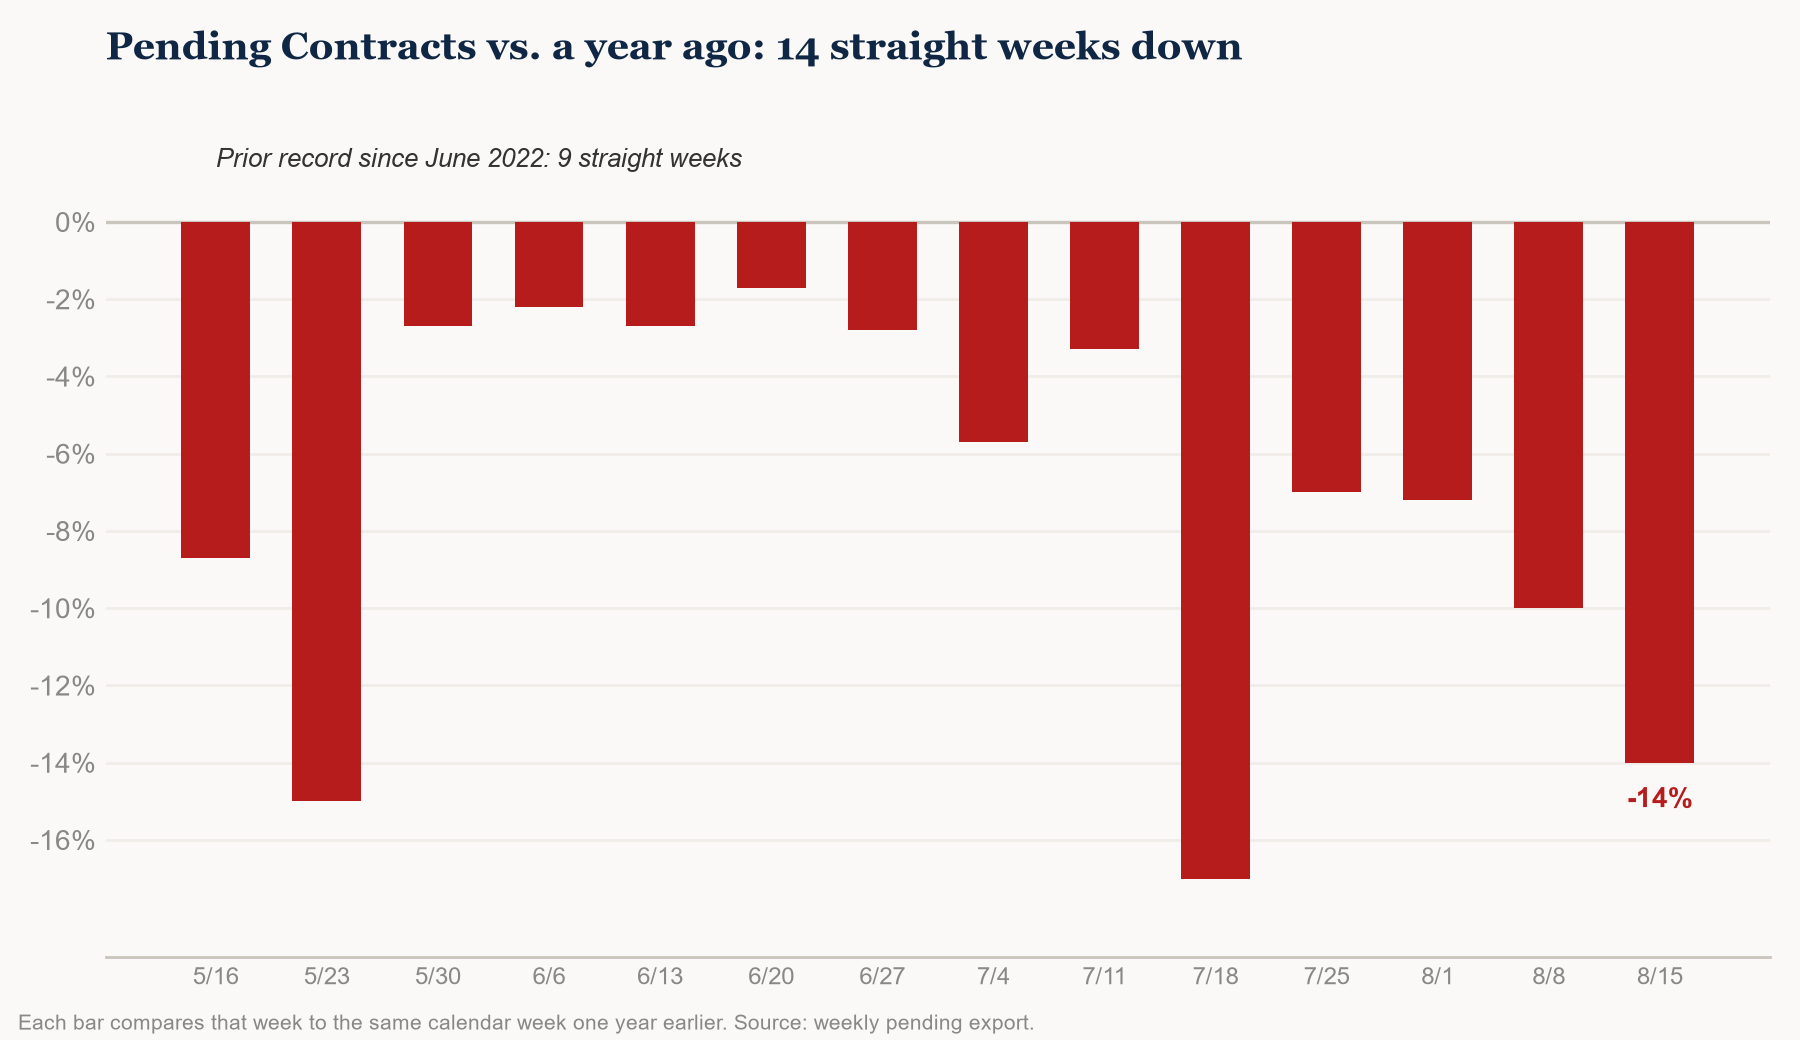
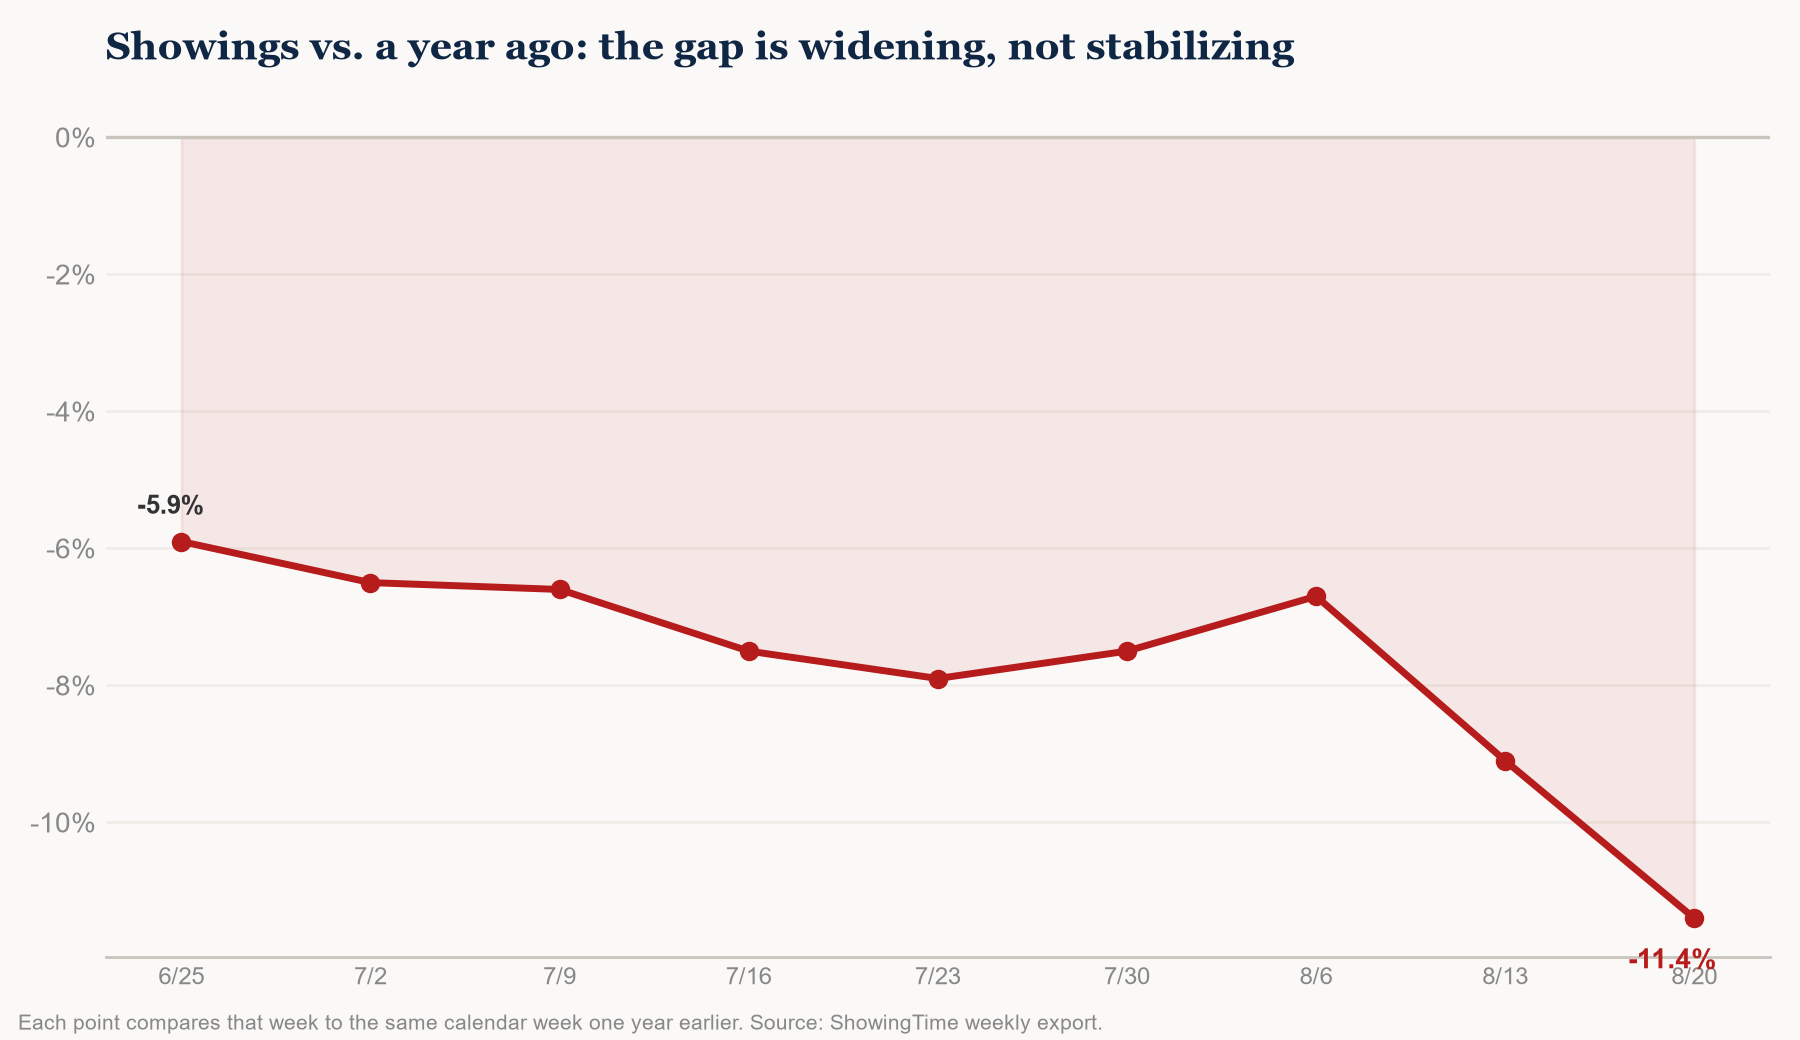
Denver metro’s back-half-of-summer story isn’t inventory this year — it’s demand. Pending contracts just finished their 14th straight week below last year’s pace, a new record that breaks the prior high of 9 straight weeks. Showings, which move before contracts do, are down every week over the same stretch, and that gap has been widening rather than closing. Inventory itself is actually a little lighter than a year ago, so this isn’t a supply story. It’s a buyer-hesitancy story, and this week’s data says it isn’t done yet. That continues the shift we first flagged in last week’s update.
Pending Contracts
800 New Contracts — A Record 14th Consecutive Week Below Last Year
Week over week
+0.4%
Essentially flat
vs. last year
-14%
14 consecutive weeks lower
Prior record streak
9 wks
Set since June 2022
This is the longest streak of year-over-year pending declines we’ve recorded since June 2022 — already more than 50% longer than the previous record. It’s also sharper than a typical repeat: the same 14-week stretch last year wasn’t even in decline, five of those weeks were actually up. That combination is a real signal, not routine seasonal noise. Week to week the number barely moved (800 vs. 797), which tells us this is a slow, sustained pullback that’s been building since May — not a sudden shock.
Showings
13,755 Showings — The Leading Signal Is Still Weakening
Week over week
-0.3%
Roughly flat
vs. last year
-11.4%
Widest gap in 9 weeks
Gap, 9 weeks ago
-5.9%
Nearly doubled since
Showings lead pending contracts — buyers walk through homes before they write offers. That’s why this chart matters more than the pending numbers alone: the year-over-year gap has widened in five of the last six weeks instead of stabilizing. When the leading indicator keeps getting worse, it’s a reasonable bet the pending deficit isn’t finished yet.
Active Inventory
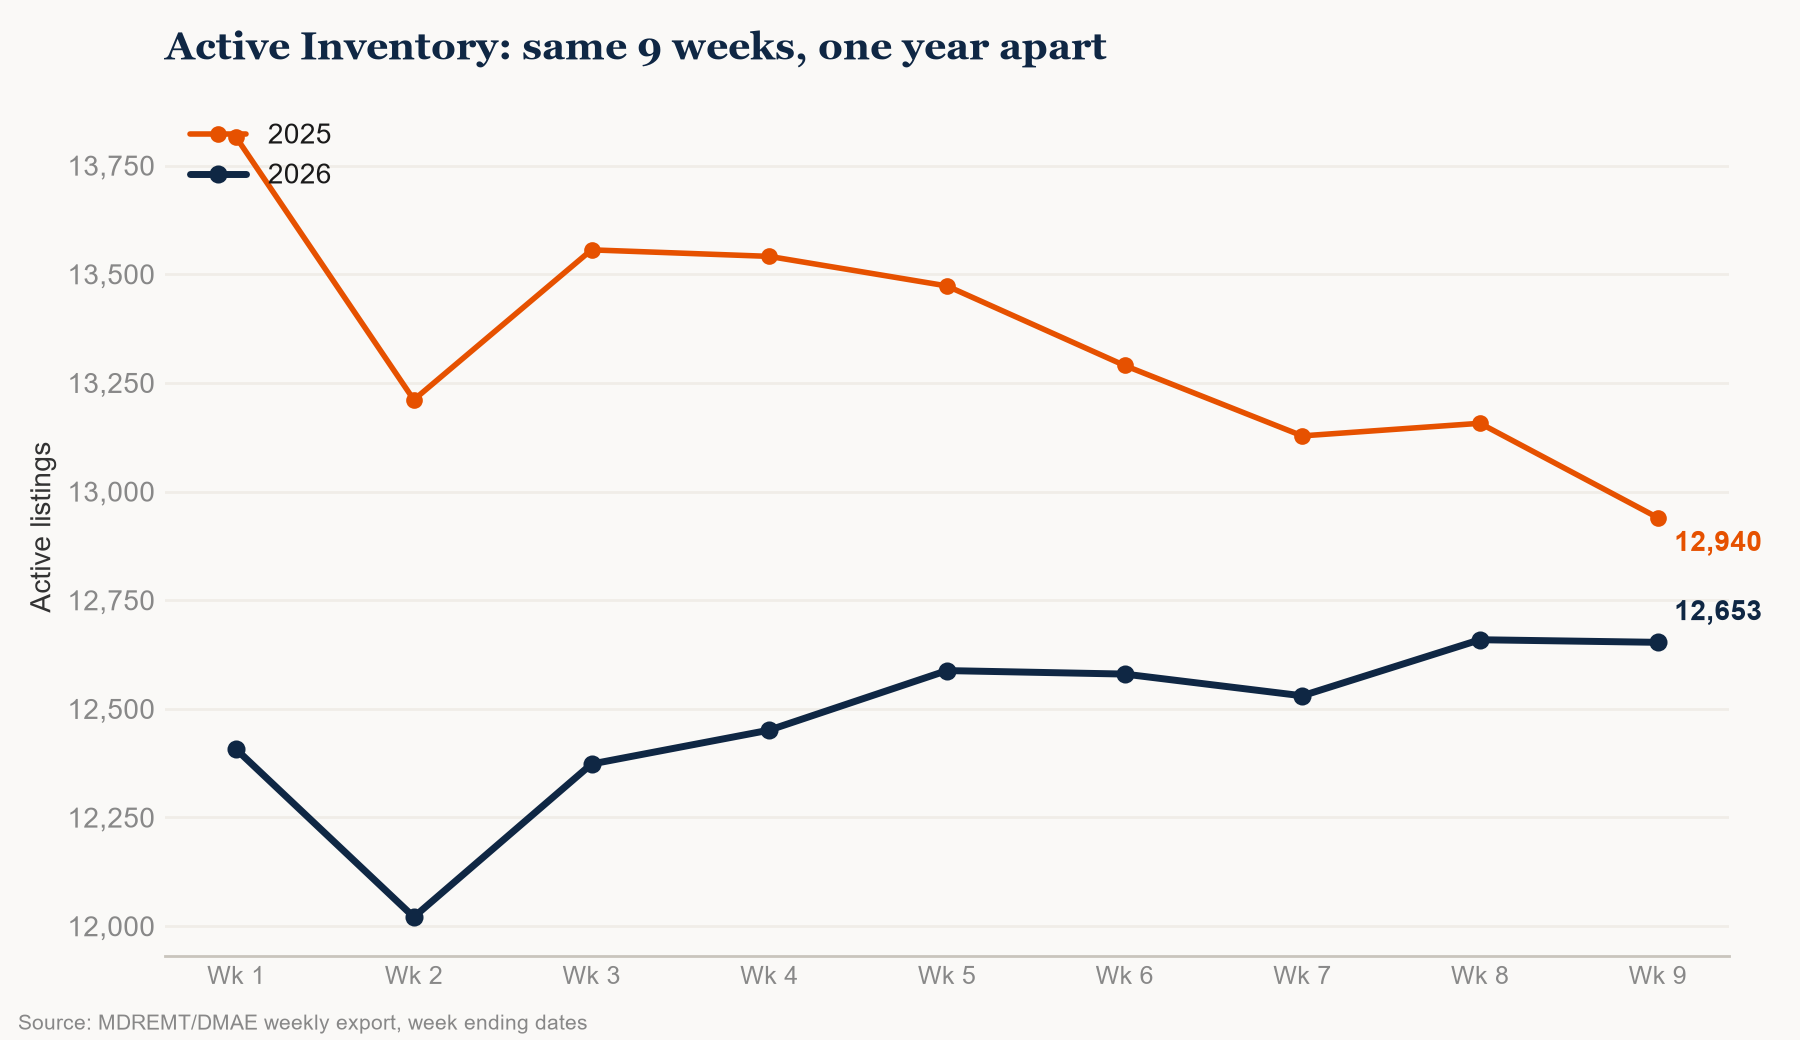
12,653 Active Listings
Week over week
+0.0%
Unchanged
vs. last year
-3.8%
Modestly lighter
9-week change
+2.0%
vs. -6.3% same stretch LY
This is where the slowdown is not coming from. Inventory has actually grown slightly over the last 9 weeks, while the same stretch last year saw inventory fall 6.3%. There’s no flood of new supply pushing this market — the pullback we’re tracking this week is entirely on the demand side.
New Listings
1,146 New Listings
Week over week
+1.9%
Small uptick
Median SFR list price
$670,000
Median attached list price
$400,000
Steady week for new supply — nothing here changes the picture above.
Closings
693 Closings — Fewer Sales, But Prices Holding
Week over week
-3.8%
720 → 693
vs. last year
-12.7%
Fewer closings
Median close price vs. LY
+2.4%
Prices still resilient
|
SFR |
Condo |
Townhome |
| Median closed price |
$649,500 |
$324,000 |
$440,000 |
| Median days on market |
20 |
36.5 |
46 |
| List-to-close ratio |
98.4% |
97.1% |
96.3% |
| Concession rate |
61.3% |
51.1% |
63.5% |
| Median concession |
1.7% |
2.4% |
2.6% |
| Net ratio (after concessions) |
97.0% |
95.7% |
94.4% |
| Closed over asking (gross) |
19.9% |
7.6% |
7.9% |
| Closed over asking (net) |
11.7% |
4.3% |
6.3% |
Fewer homes closed this week and volume is down double digits year-over-year, but the sellers who did close aren’t leaving much on the table — a 97.0% net ratio on SFR after concessions is a healthy number even in a buyer-favoring market. Condos remain the softest segment: a 51% concession rate and a 95.7% net ratio versus SFR’s stronger showing.
Price Reductions
56.1% of Active Listings Have Reduced — and the Longer a Home Sits, the Deeper the Cut
This week
56.1%
+0.3 pt from last week
10-week climb, then plateau
51.4% → 56%
Leveled off since Aug 8
Median reduction
$25,000
Unchanged
Reduction share climbed for 10 straight weeks before leveling off around 56% for the last three — not a reversal, just a plateau at the highest level we’ve tracked this year. With pending contracts and showings both still soft, there’s no reason yet to expect it to come back down.
New this week: we can now see reduction behavior broken out by how long a listing has been on the market, and the pattern is exactly what the leading-indicator thesis predicts. For SFR listings, reduction frequency climbs from just 1% of homes on the market 7 days or less, to 67% by the 31-60 day mark, to a plateau around 85% past 90 days. The size of the cut grows too — a typical reduction is about 2.5% of list price in the first month, but 8% for homes that have sat 181+ days. Two cities are also worth flagging: Highlands Ranch and Lakewood, the two markets running furthest above the metro average all year, both eased back from their peak this week (73.0% → 69.4% and 71.1% → 68.4%, respectively) — and Arvada has now declined for three straight weeks (58.6% → 55.4% → 54.5%), dropping from above the metro average to below it.
Months of Supply
Rising Across Every Property Type
Closed MSI3.4
Pending MSI (now)3.2
Pending MSI (4 wks ago)3.0
Closed MSI8.1
Pending MSI (now)7.9
Pending MSI (4 wks ago)7.1
Closed MSI5.7
Pending MSI (now)5.1
Pending MSI (4 wks ago)5.3
Every segment is trending toward more months of supply, and condos are moving fastest — up a full point of supply in four weeks. Townhomes are the one exception worth watching: pending MSI actually ticked down slightly over the same window, worth confirming next week before reading much into it.
Expired Listings — Worth a Flag
423 Expirations, Up 14% Week Over Week
This week
423
+14% week over week
We don’t cover expired listings every week — this one earns a look because of the size of the jump. Price reductions haven’t moved enough yet to fully explain it, and one week isn’t a trend on its own. If it repeats next week, it stops being a footnote.
The Big Picture — and Our Call
Pending contracts just broke a four-year record for consecutive year-over-year declines, and showings — the indicator that leads pending contracts — are getting weaker, not stabilizing. Inventory isn’t the driver here; it’s actually a little lean compared to a year ago, and closed prices are holding up better than closing volume. This lines up with what’s showing up in national coverage this month too, which has been describing a housing market that may have already peaked for the year, largely on the back of stretched affordability and buyers who can afford to wait.
Our call: we expect the pending contracts deficit to persist rather than begin closing over the next month. We’re not calling a bottom — we’re calling a continuation. We’ll grade this call the week showings’ own year-over-year gap either improves past -8% for two straight weeks (a real signal demand is coming back) or worsens past -15% (a signal this is accelerating), whichever happens first. Based on the pace of the last several weeks, that’s likely 6 to 10 weeks out. We’ll check in on it here.