



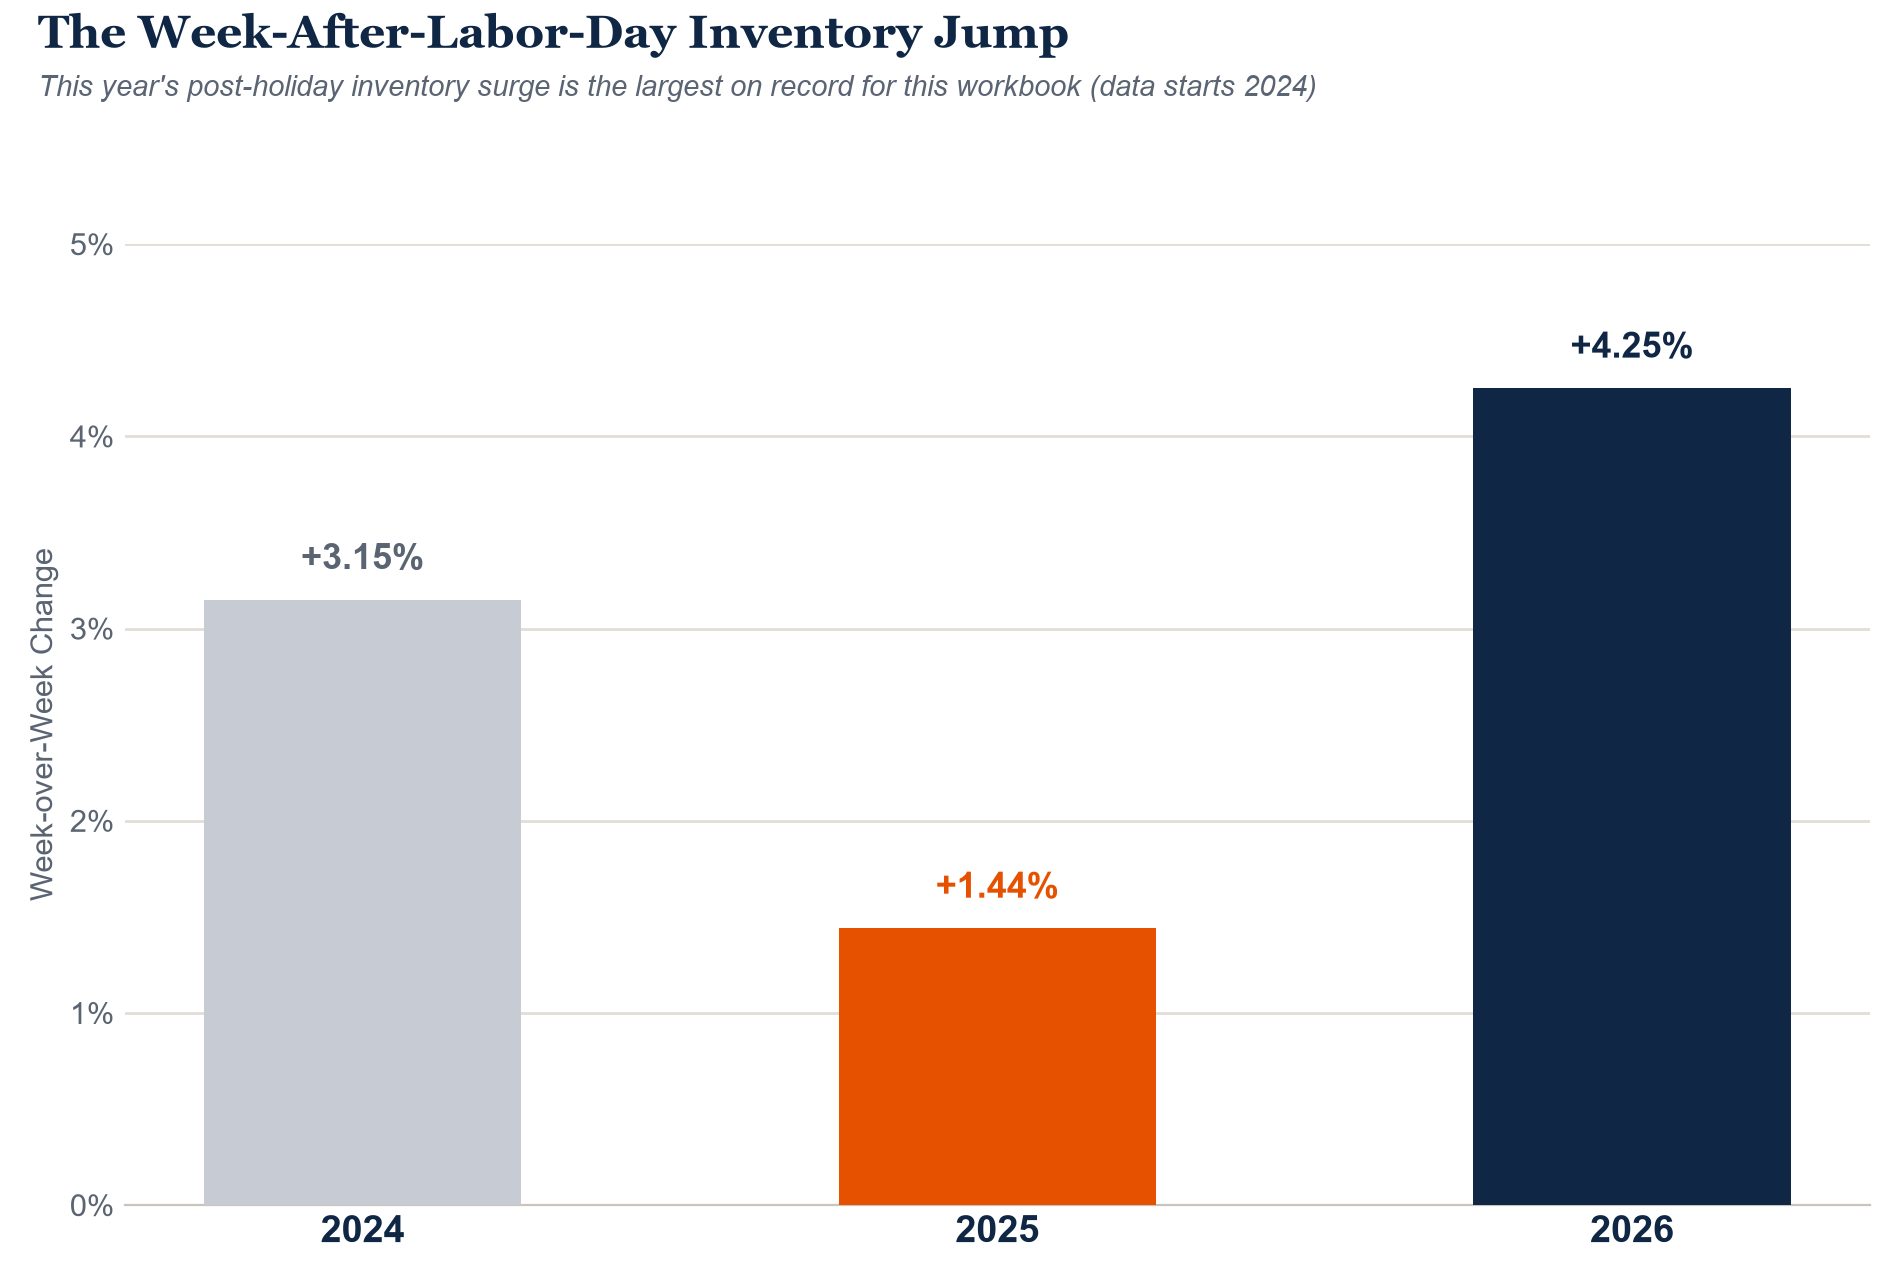
Rates crossed 7% this week for the first time in over 15 months. Inventory posted its largest post-Labor-Day surge in the three years we can measure. And underneath both, a genuinely useful signal emerged: the buyers still touring homes are converting to contracts at a better rate than the recent trend, even as fewer buyers show up to tour in the first place. None of this points to panic, but it is a market facing real, compounding pressure that deserves a clear-eyed look rather than a soft one. That continues the thread from last week’s update.
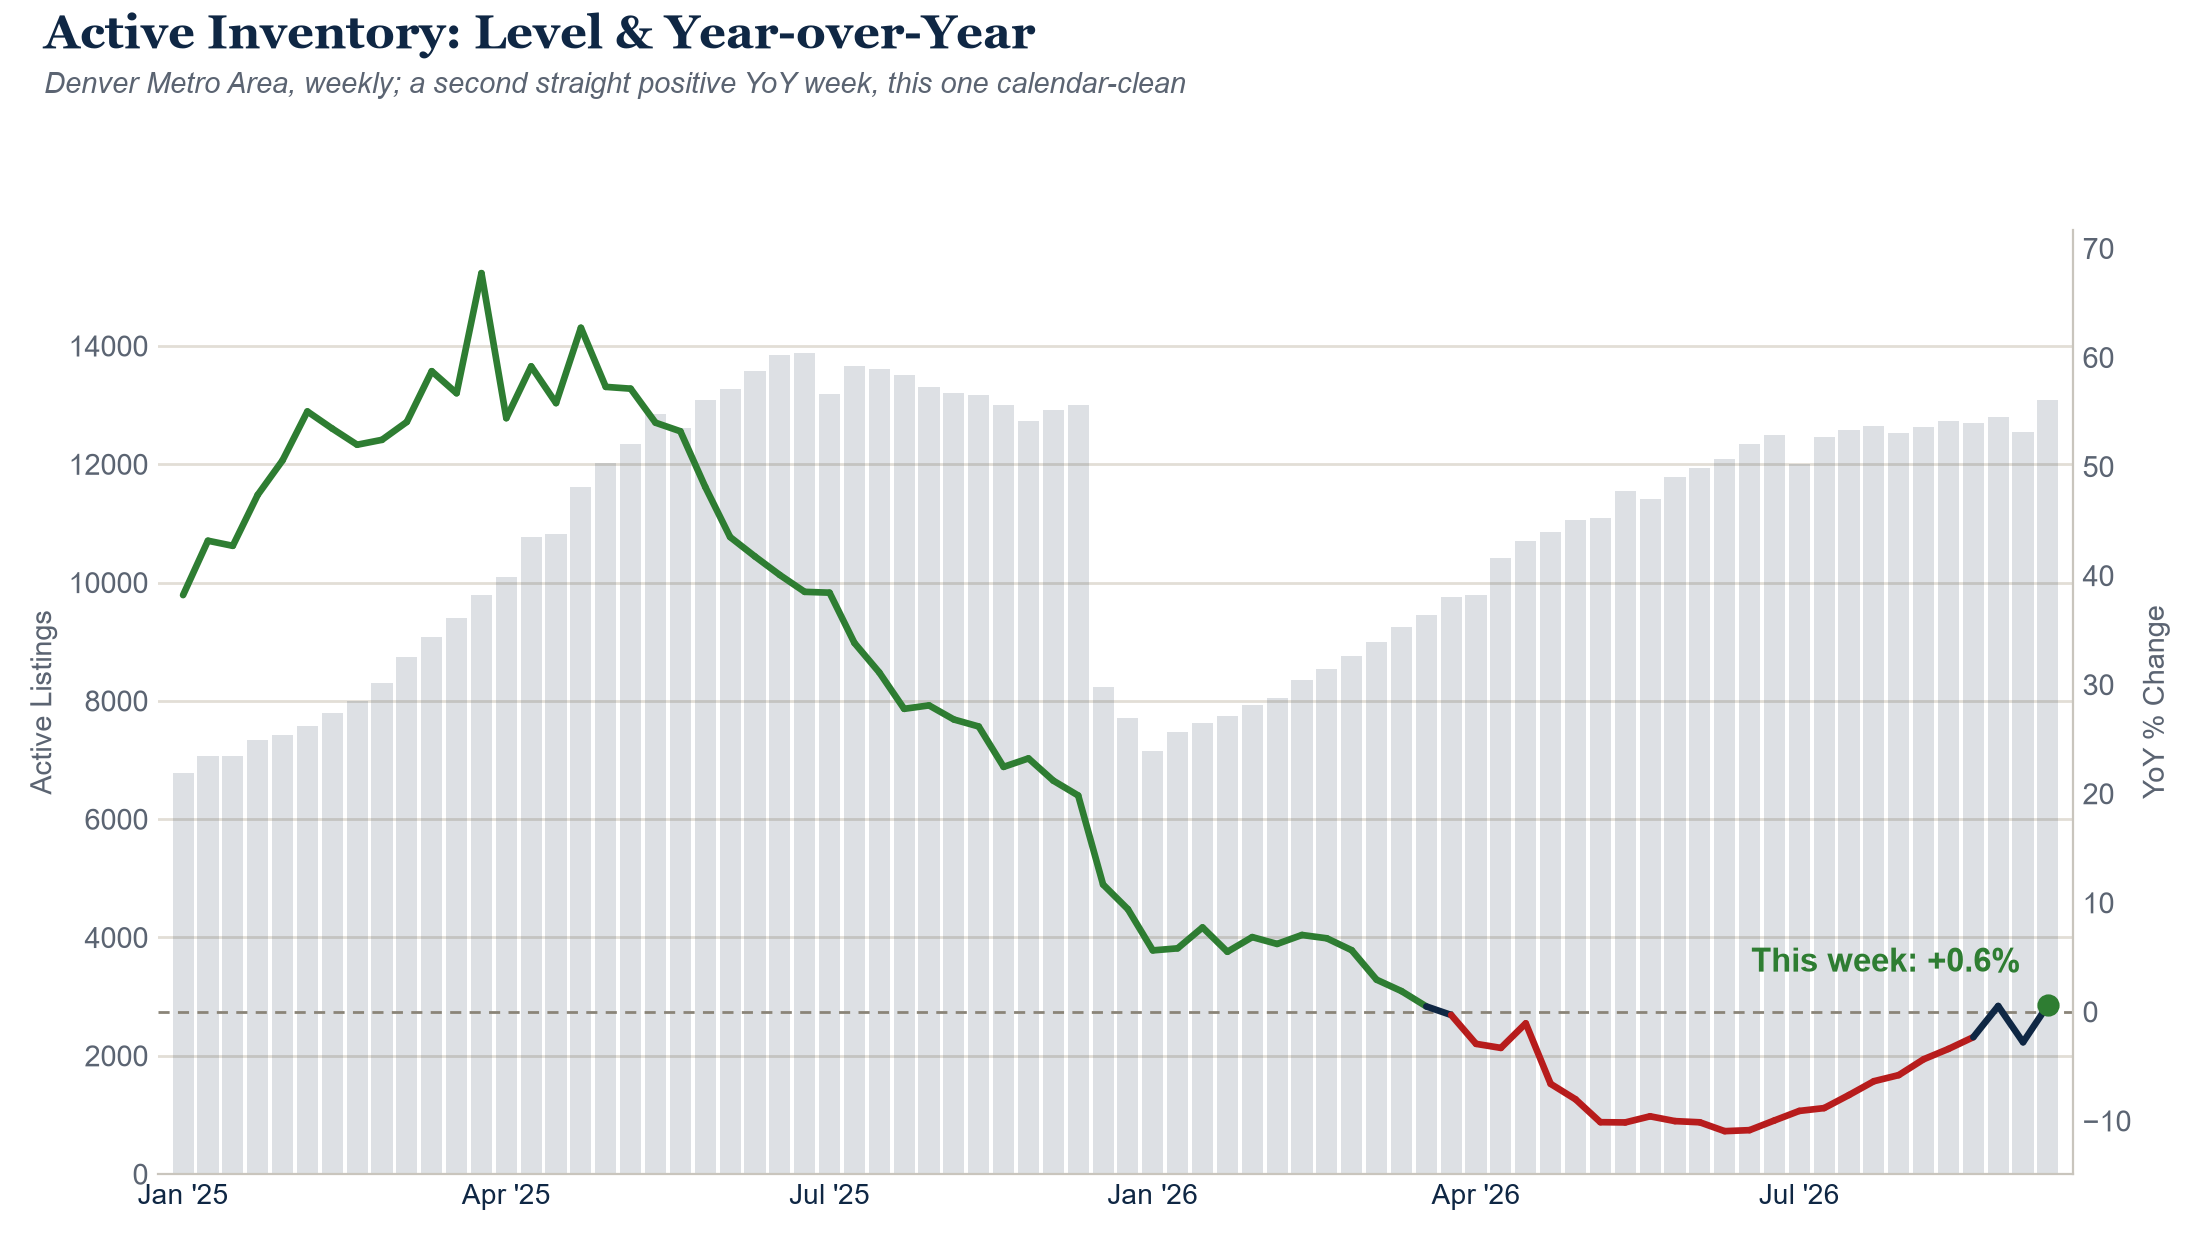
13,080 Active Listings: A Real, Clean Second Positive Week


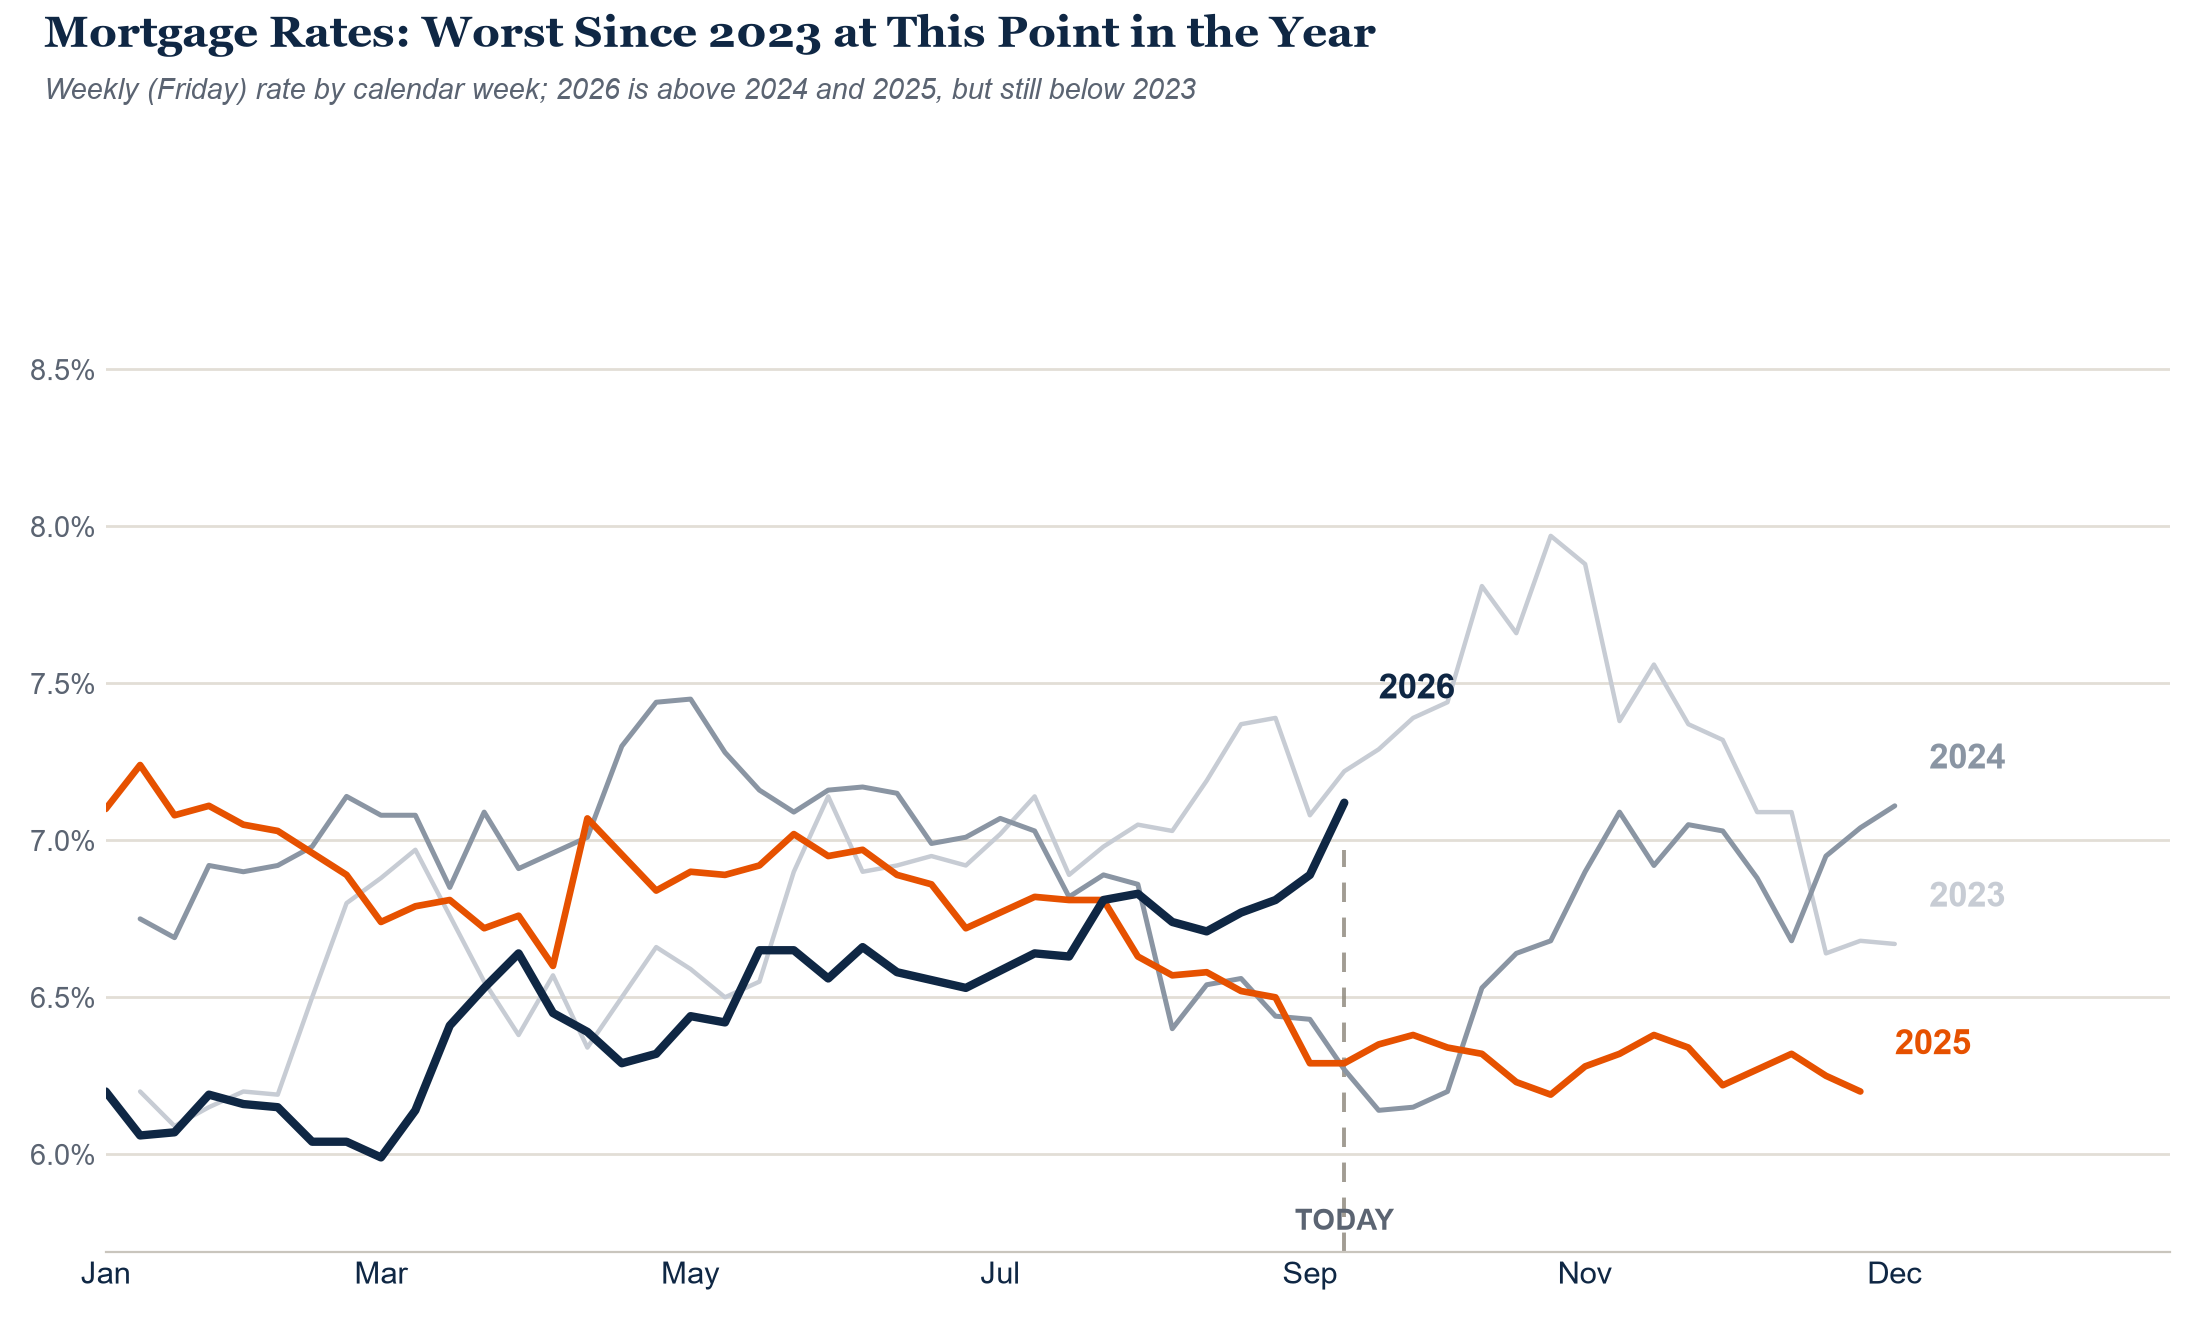
7.12%: Rates Cross 7% for the First Time Since Early 2025

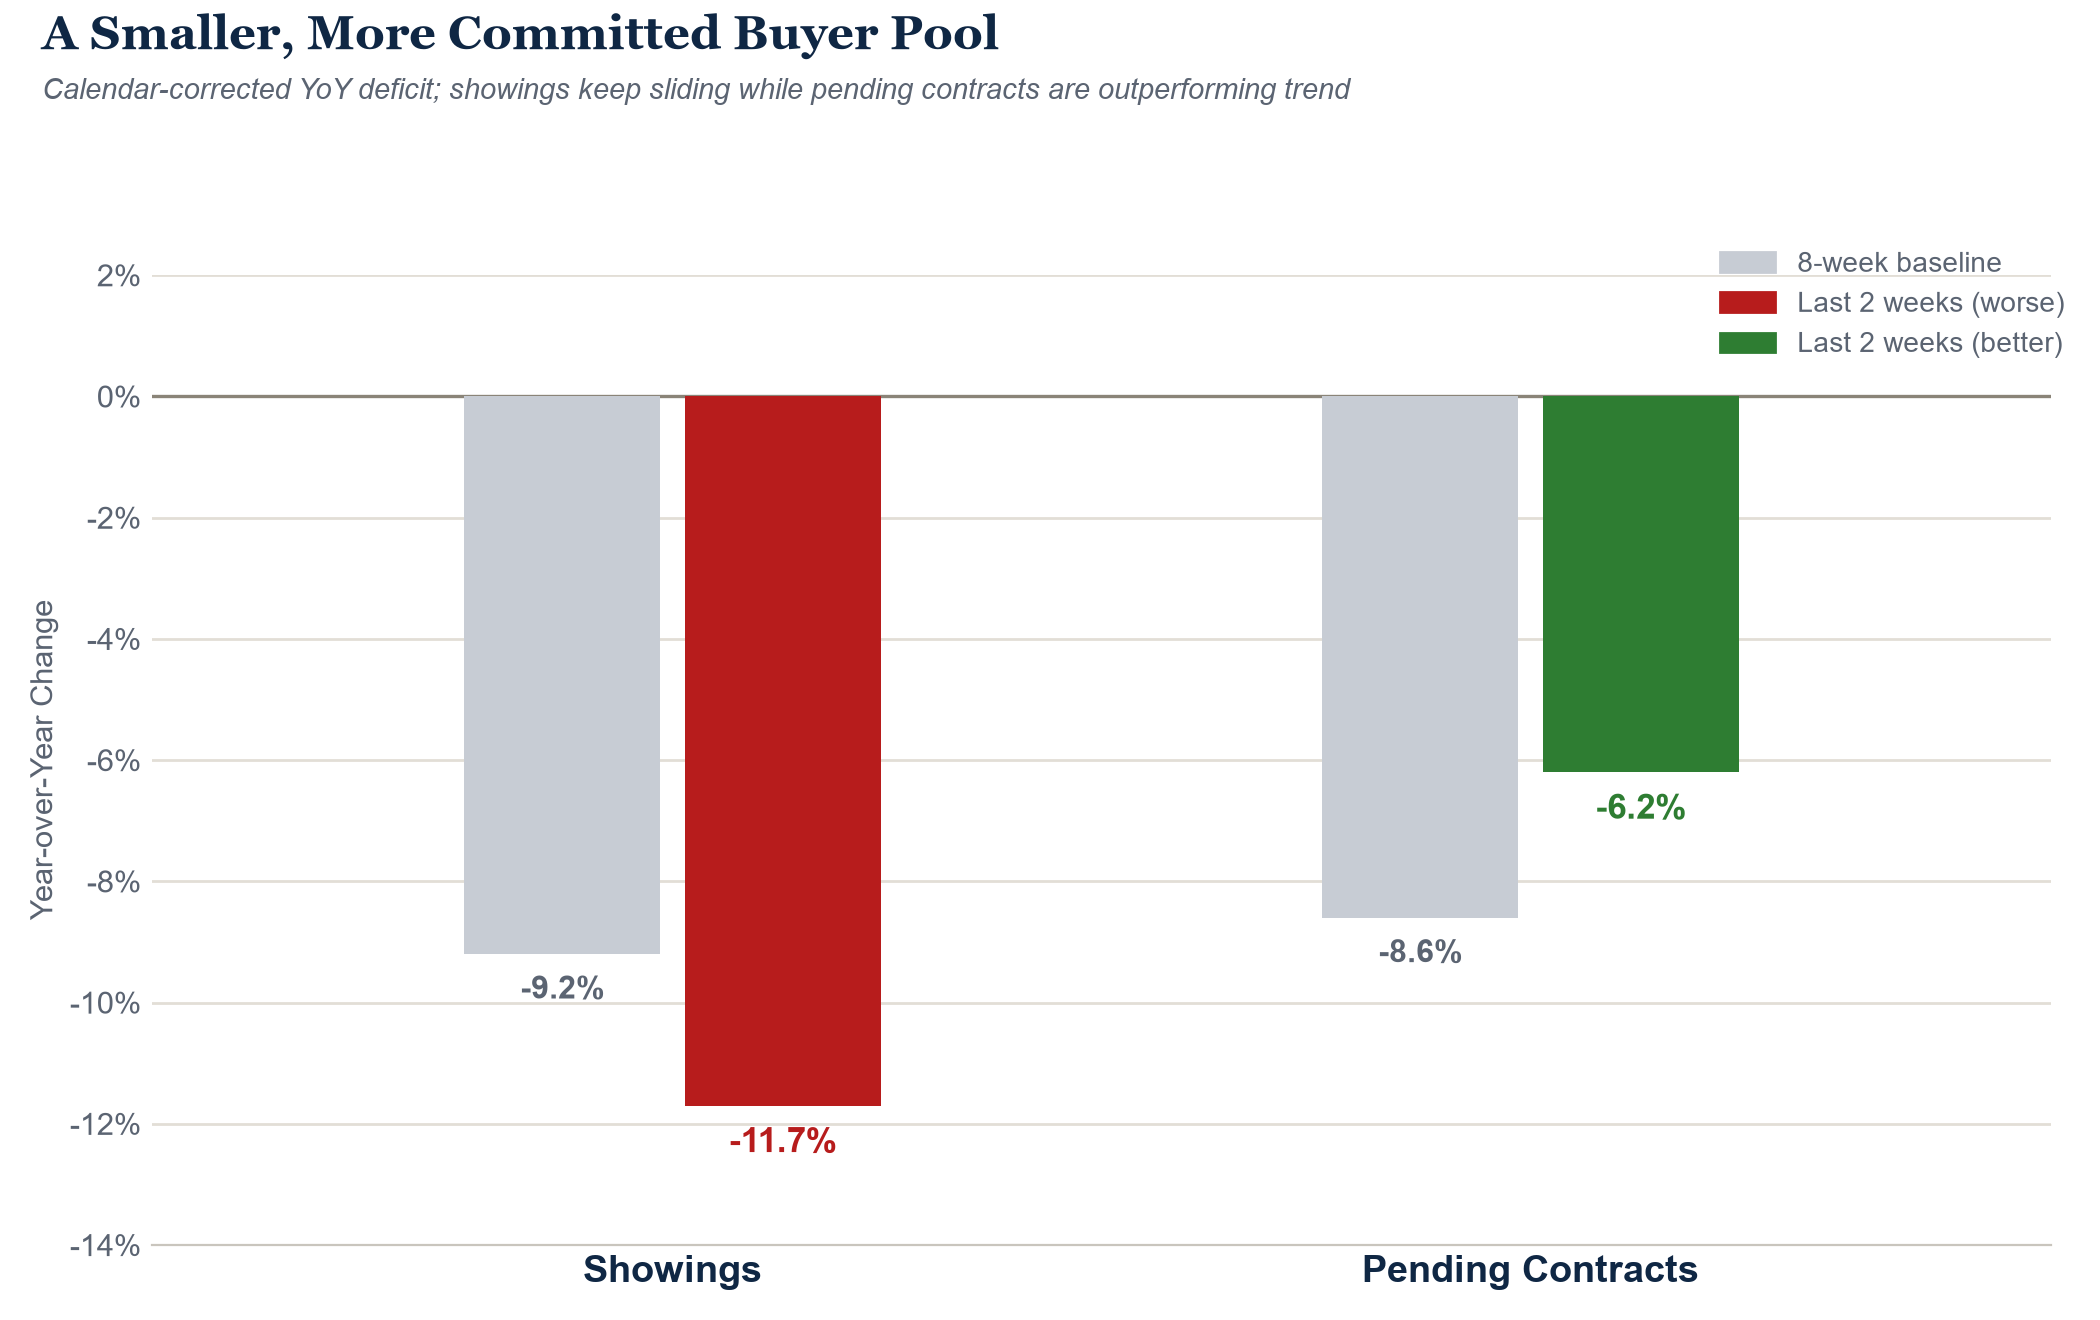
680 New Contracts: A Real Bright Spot Underneath the Noise
12,138 Showings: The Deficit Is Actually Widening

993 New Listings
A quieter week for new supply. Nothing here changes the inventory story above: that surge is coming from existing listings staying active longer and the post-Labor-Day rebound, not a wave of new ones.
783 Closings: Volume Up, Time to Close Levels Off
Days on market pulled back to 28 this week after climbing from 20 to 31 over the prior eight weeks. Worth watching whether this is a genuine leveling-off or just one week’s noise before we call it a new direction.
56.5% of Active Listings Have Reduced, and the YoY Gap Widened
4.29: Bouncing, Not Climbing in a Straight Line
Worth being precise here: MSI has bounced between 4.29 and 4.47 for three straight weeks rather than climbing in a straight line the way the last two issues described. The underlying pressure (weak closings, weaker demand) hasn’t reversed, but the climb toward 5.0 has stalled for the moment rather than continued. See the Call check below.
665 Expirations: The Real Story Is the Pace, Not the Spike
665 listings expired this week, sharply higher than the prior week, but that jump alone is misleading. Listing agreements cluster around month-end, so any week containing the last day of a month always runs well above the weeks around it; comparing this week to a normal week is comparing two different things. The fair comparison is month-end week to month-end week, and that comparison is worth watching closely: this year’s end-of-month expiration counts have been climbing at an accelerating pace: June’s 473 grew to July’s 505 (+6.8%), then to August’s 561 (+11.1%), then to this week’s 665 (+18.5%). Each month is growing faster than the one before it. Against the same month-end week a year ago, though, the increase is far more modest: 665 versus 640, up just 3.9%. Median days on market for expirations hasn’t moved much either way (93 this week, 94 a year ago). Worth tracking whether that accelerating month-over-month pace continues or was itself a one-off.
The Big Picture: Call Status and a New Call
Three things are true at once this week, and they fit together: mortgage rates just posted their sharpest short-term jump in a while and crossed 7% for the first time since early 2025, inventory is building faster after Labor Day than in either of the last two years, and demand is fragmenting rather than collapsing evenly: fewer buyers touring homes, but the ones still out there converting to contracts better than the recent trend. Price reductions are falling further behind last year’s pace, not catching up, and expirations are growing at an accelerating month-over-month pace even after adjusting for the normal end-of-month clustering. None of this is a single dramatic break; it’s several real, moderate pressures compounding at the same time, right as the rate environment gets meaningfully worse. That lines up with what’s being reported nationally too: demand tends to hold up below 6.64% and fade above 7%, and the whole country just crossed that line alongside us.
Call check – pending deficit: we called for the pending deficit to persist, graded when Showings’ YoY gap either improves past -8% for two straight weeks or worsens past -15%. The clean reading (Sept 4, before the Labor Day noise) sat at -2.9%; this week’s calendar-corrected 2-week view showed the deficit widening to -11.7%. Neither exact trigger has formally fired yet, but the underlying trend is leaning toward the call being right, not wrong. Still open.
Call check – months of supply: MSI hasn’t cleared 5.0 or dropped below 4.1 for two straight weeks, so this stays open on its own terms, but it’s bounced between 4.29 and 4.47 for three weeks running rather than climbing steadily, worth watching whether the underlying pressure starts pushing it higher again now that rates just moved against buyers further.
Call check – active inventory: we called for inventory to cross back to positive YoY within 1-2 weeks and hold through the rest of 2026. One week later, it did exactly that, and this week’s reading checks out clean under the calendar correction too. Two calendar-clean data points now support this call; we’ll keep checking every week through the year-end grading date.
New call: with rates crossing 7% for the first time in over a year, and Showings’ deficit already widening before this move even hit, we expect the pending contracts improvement noted above to be short-lived rather than the start of a new trend. We’ll grade this over the next 4-6 weeks: call right if Pending Contracts’ calendar-corrected 2-week reading falls back to match or exceed the 8-week baseline deficit (around -8% to -9%), reversing this week’s improvement; call wrong if the pending resilience holds or strengthens despite the higher rate environment.