



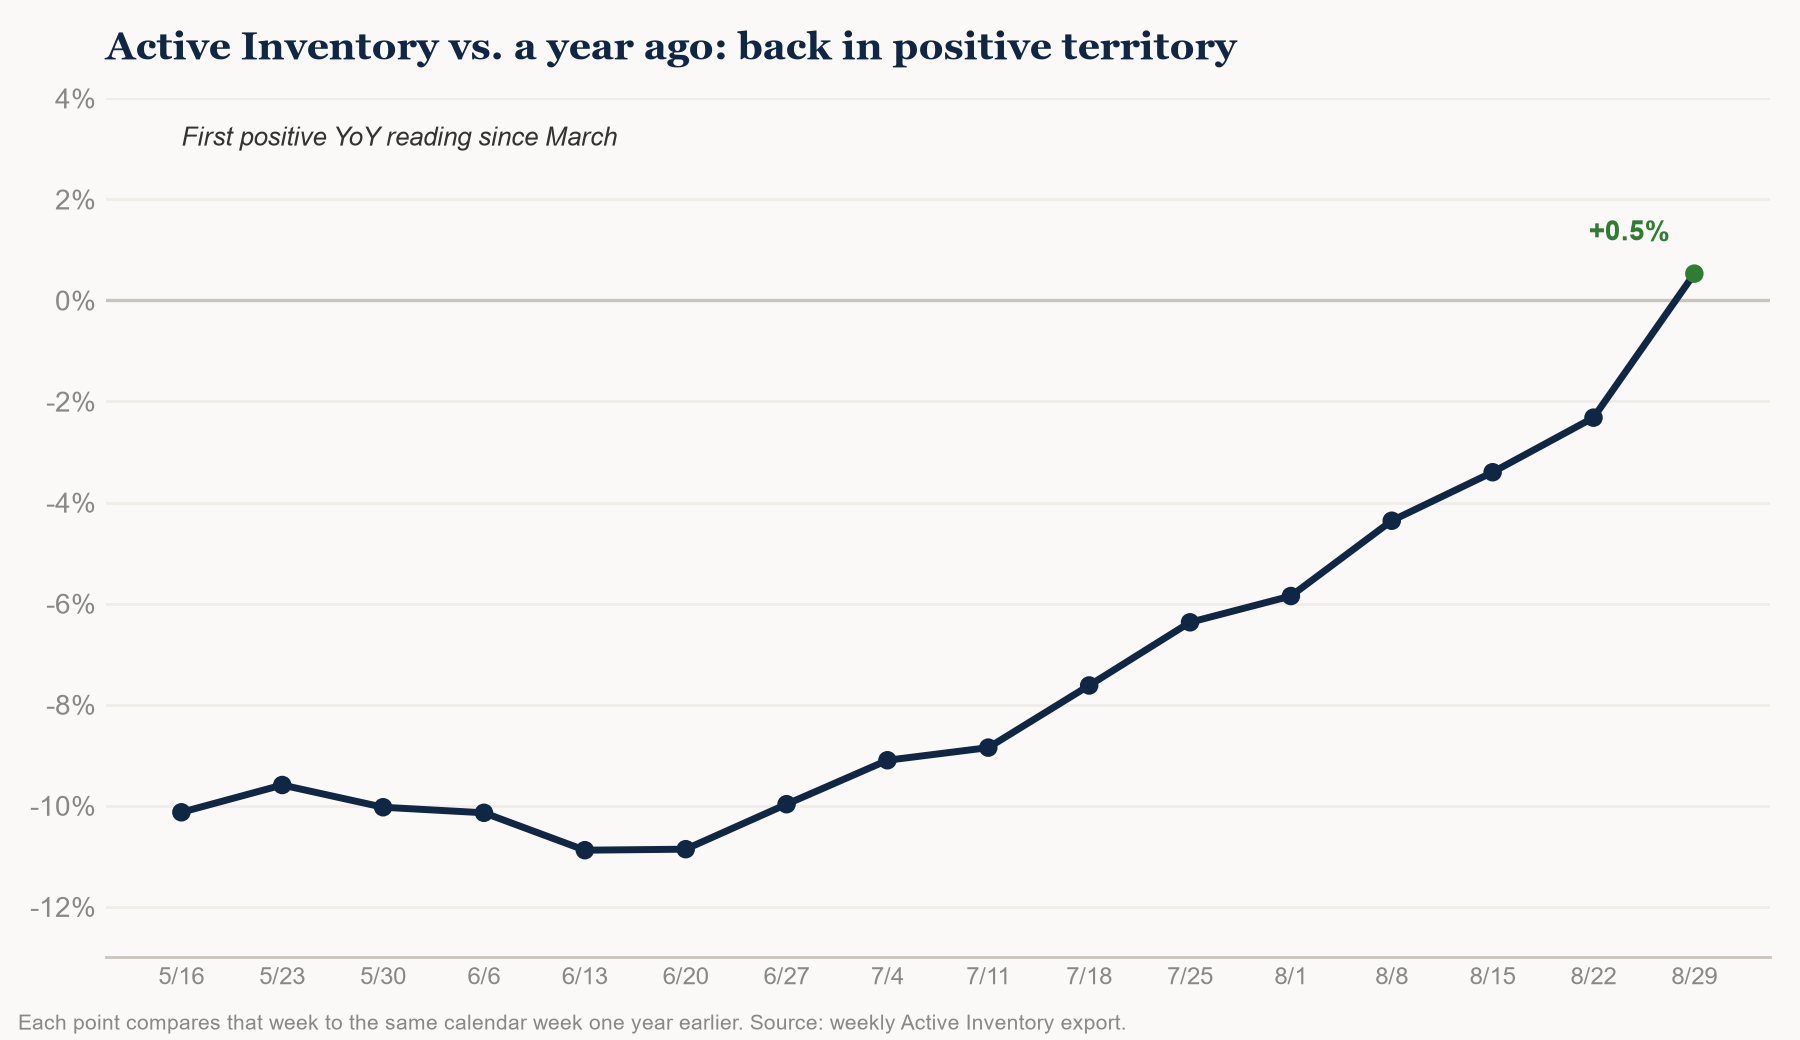
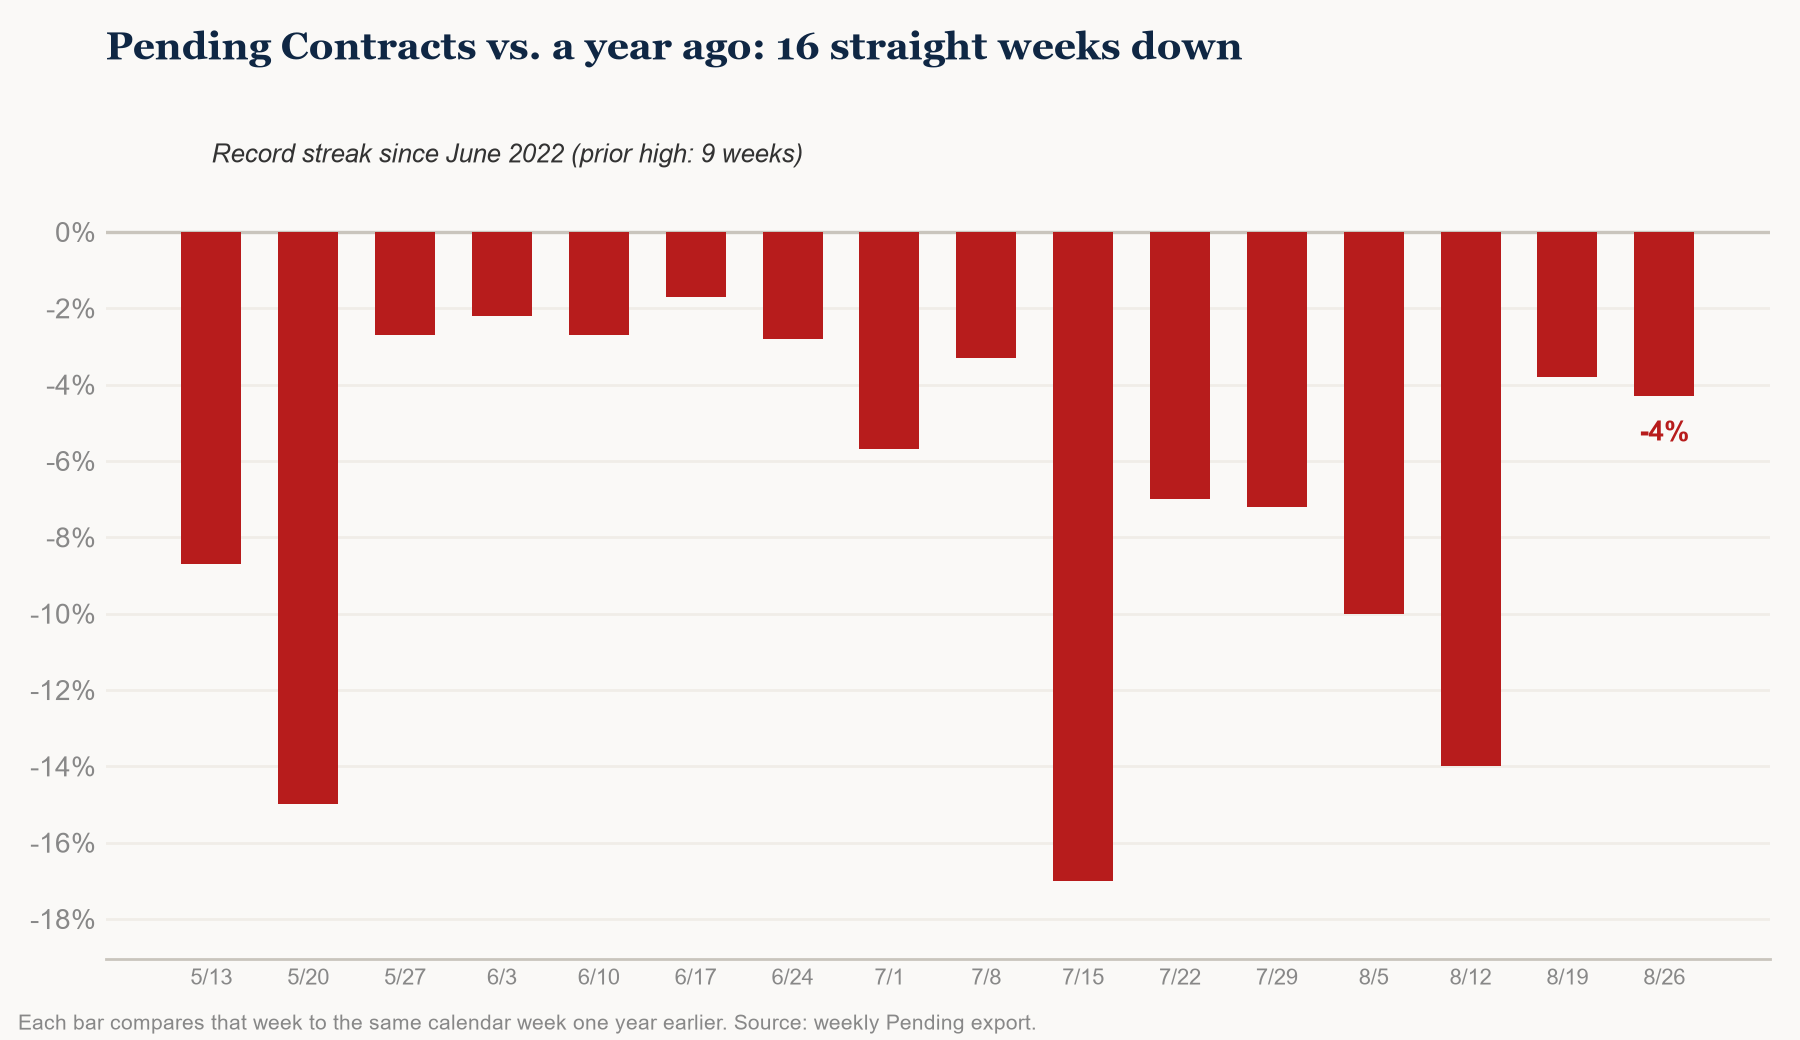
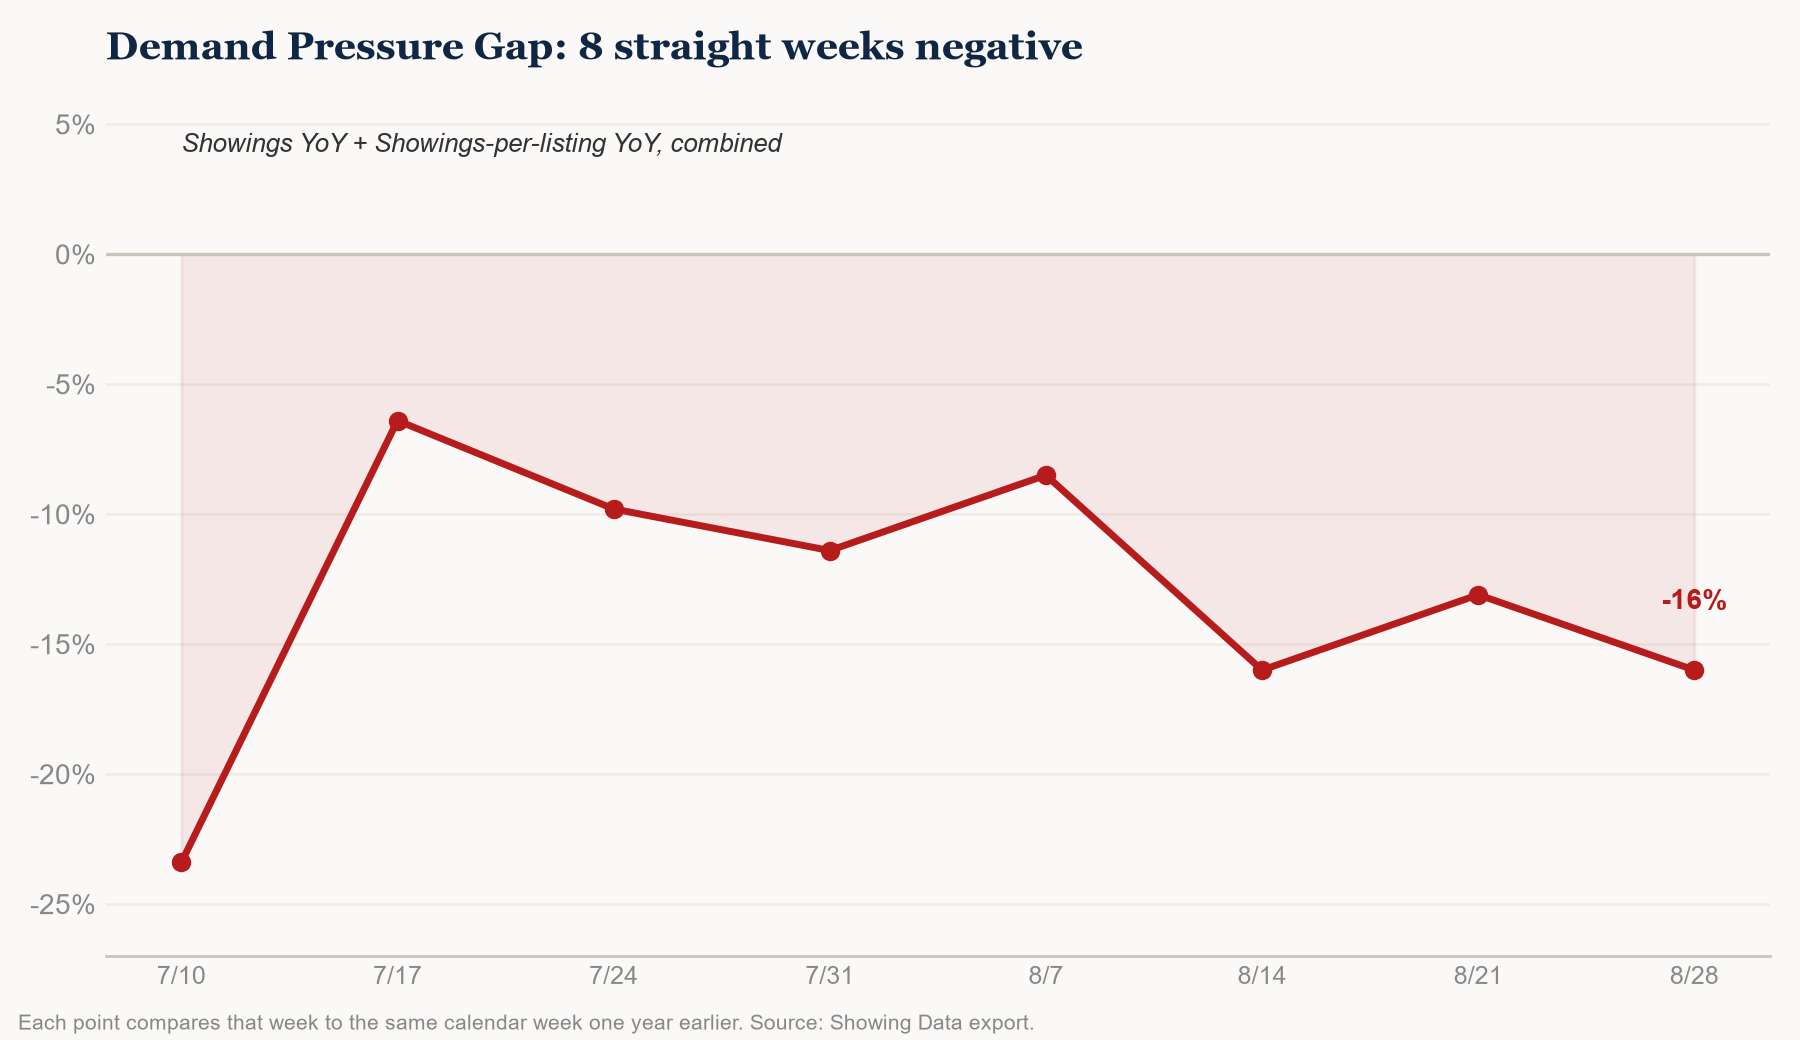
Denver metro just crossed a real threshold: active inventory posted its first positive year-over-year reading since March, after climbing out of a double-digit deficit over the past three months. Don’t mistake that for a demand recovery, though — pending contracts just extended their record streak to 16 straight weeks below last year, showings are down for an 8th consecutive week, and our Demand Pressure Gap index just posted one of its worst readings of the run. Supply is catching up. Demand still isn’t. That’s exactly the combination that pushes months of supply higher, and that’s what we’re seeing too. That continues the shift we’ve been tracking in last week’s update.
12,792 Active Listings — First Positive YoY Reading Since March

800 New Contracts — Record Streak Extends to 16 Weeks
13,778 Showings — Demand Pressure Gap Still Deepening
1,140 New Listings
A quieter week for new supply, but nothing here changes the picture above — the inventory story this week is about existing listings staying on the market longer, not a surge of new ones.
693 Closings — Volume Flat, Still Down Sharply From Last Year
| SFR | Condo | Townhome | |
|---|---|---|---|
| Median closed price | $647,500 | $312,500 | $433,950 |
| Median days on market | 24 | 51 | 45 |
| List-to-close ratio | 97.5% | 94.2% | 96.2% |
| Concession rate | 60.9% | 46.9% | 69.2% |
| Median concession | 1.8% | 2.0% | 2.1% |
| Net ratio (after concessions) | 96.2% | 93.9% | 94.3% |
56.7% of Active Listings Have Reduced — A New High for the Year
This week’s 56.7% is the highest share of reduced listings we’ve recorded all year, continuing a climb that’s been running since late May (51.4% → 56.7%). Worth a precise read here rather than a rounded one: the absolute number keeps climbing toward where last year’s number sits, but the actual year-over-year gap hasn’t measurably closed over that same stretch — it’s held in a roughly 3-to-4-point band, if anything a little wider in the most recent weeks. Both things are true at once: reductions are becoming more common in absolute terms, but this year hasn’t caught up to last year’s pace, it’s climbing alongside it.
4.29 — Climbing Again
This is the mechanical result of everything above: inventory recovering while pending contracts and showings stay near record-weak. Every additional week of that combination pushes months of supply a little higher, and that’s exactly what’s happening.
The Big Picture — Call Status and a New Call
This week’s real news is the inventory crossover — the first positive year-over-year reading since March, after a three-month climb out of a double-digit deficit. But it’s a supply-side story, not a demand one. Pending contracts just extended a four-year record to 16 straight weeks below last year, showings are down for an 8th straight week, and the Demand Pressure Gap is deepening rather than stabilizing. Mortgage rates are a real but modest factor — up about a third of a point from a year ago, a fraction of the roughly 4-point move that drove the 2022-2023 collapse — which means rates alone don’t fully explain a pullback this persistent. That lines up with what’s being reported nationally too: buyer demand is reshaping faster than expected in a lot of markets, and affordability fatigue — not any single rate shock — looks like the bigger driver.
Last week’s call, status check: we called for the pending deficit to persist, graded when showings’ YoY gap either improves past -8% for two straight weeks or worsens past -15%. It’s sitting at -8.8% this week — through the -8% mark but not yet at -15%. Neither trigger has fired. Call stays open.
New call: with supply recovering and demand still near its weakest point of the year, we expect Total Months of Supply to keep climbing over the next 4-8 weeks, likely testing 5.0. We’ll grade this the week Total Closed MSI either clears 5.0 (call was right — the imbalance keeps building) or drops back below 4.1 for two straight weeks (call was wrong — supply and demand are re-balancing faster than expected). We’ll check in on both calls here.