

August 31, 2026
For three years, the story in Denver-area real estate has been simple: too many homes for sale. That pressure is finally easing. Across the 36-city metro, the number of active listings is now roughly flat compared with a year ago.
But the surplus did not clear out evenly. It concentrated, and it concentrated in one place: condominiums in the City of Denver. As of the last Saturday in August, the City of Denver held 50.9% of every condo listed in the entire metro, its active condo count was up about 45% since January, and in 2026 its condos have trailed its houses on every measure that matters to a seller: how quickly they sell, whether they sell at all, and what they bring per square foot.
Here is what the data shows, whether it is really a Denver problem or a metro-wide one, and what it means if you are thinking about selling a condo right now.
Denver holds half the metro’s condo listings
Denver naturally carries more listings than any other city; it is the largest. But its share of condos runs far ahead of its share of everything else. Denver holds roughly a quarter to a third of the metro’s houses, townhomes, and listings overall. On condos it holds half.
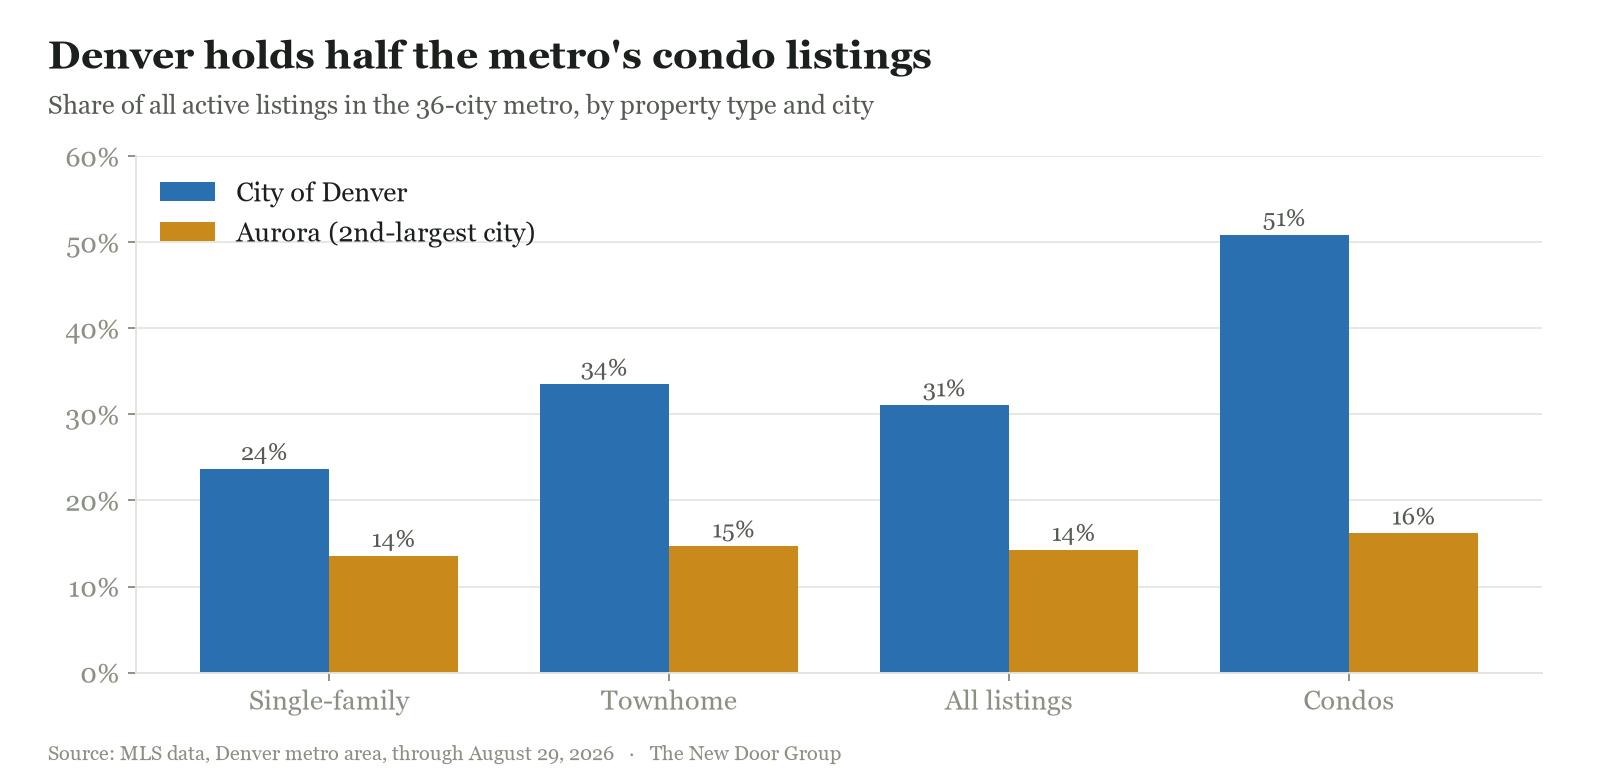
Put the two extremes side by side. Denver’s share of all listings is 2.2 times Aurora’s. Its share of condos is 3.1 times Aurora’s. The metro’s condo inventory is not spread across 36 cities in proportion to their size. It is stacked in one.
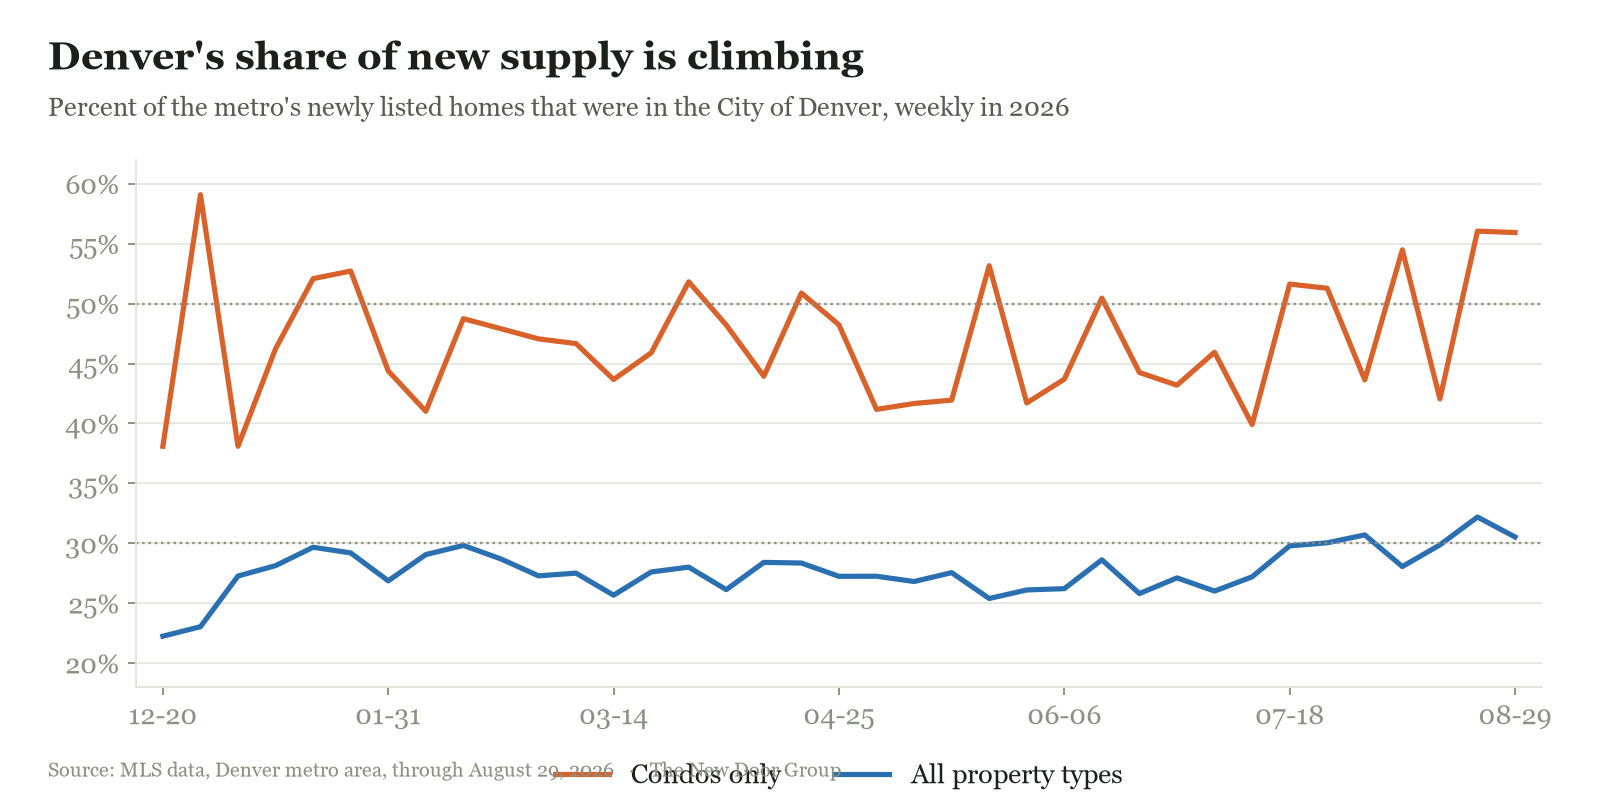
And its share of new supply is still climbing
A city’s share of new listings usually runs below its share of the standing inventory. For Denver in 2026, that gap has closed. On condos, new supply now runs above the standing share. Through mid-July, Denver’s all-types share of new listings sat in the high 20s. Since the week of July 18 it has topped 30% in five of seven weeks. Denver’s condo share of new listings has been above 50% in three of the last four weeks, at 54.5%, 56.1%, and 55.9%.
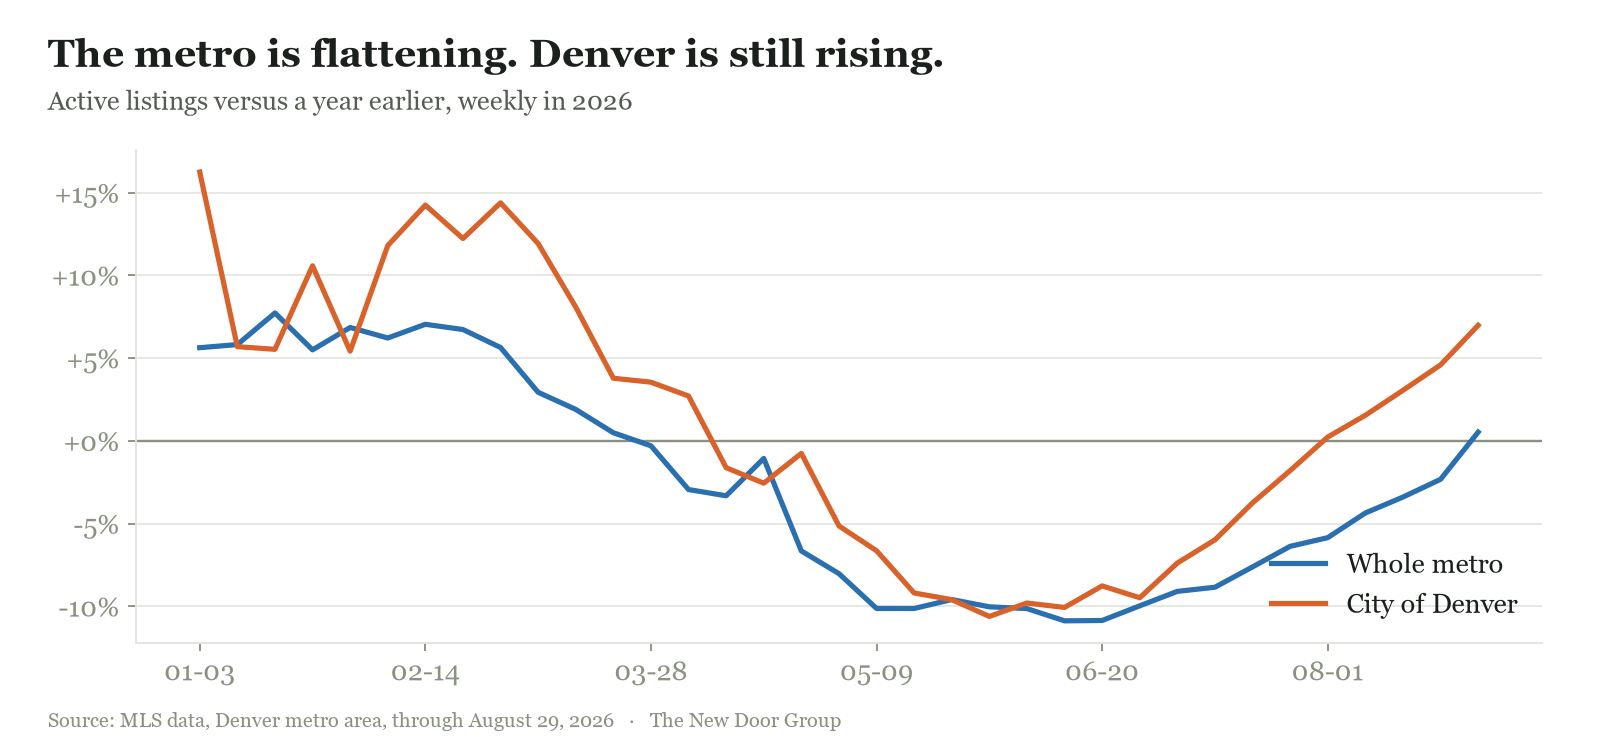
The same shift shows up in year-over-year inventory. The whole metro has moved from mid-single-digit growth to roughly flat. The City of Denver has moved the other way, from flat in spring to about 7% above last year. As the metro-wide surplus narrative cools, Denver is where the excess is now concentrating.
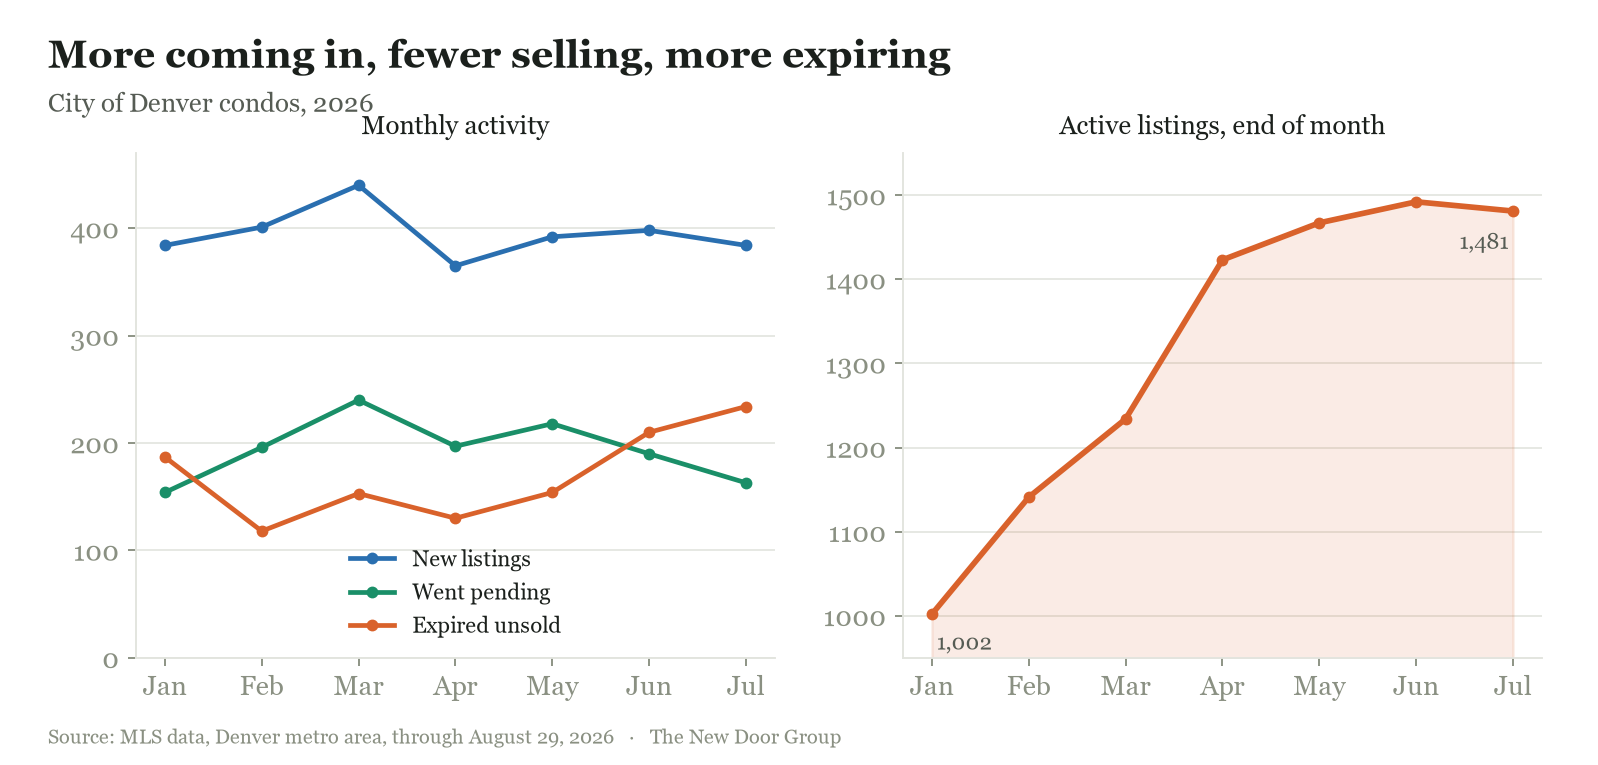
Supply is building. Demand is fading.
The clearest picture of the Denver condo market is its monthly flow. New listings hold steady near 380 to 440 a month. Contracts peaked in March at 240 and have fallen to 163. Expirations, listings that came off the market without selling, have nearly doubled, from 118 in February to 234 in July. By July, more Denver condo listings expired than went under contract. End-of-month inventory has climbed from about 1,000 in January to roughly 1,480 by mid-summer.
Is it a Denver problem, or a condo problem?
Mostly the second. The natural assumption, that the other half of the metro’s condos, spread across the suburbs, tell a healthier story, does not hold up. Suburban condos are soft too.
| Measure | City of Denver | Rest of metro |
|---|---|---|
| Active condo inventory, change since January | up 45% | up 46% |
| Median closed price, 2026 to date | $315,000 | $328,000 |
| Median finished price per square foot, 2026 closed | $312 | $281 |
| Median year built | 1974 | 1995 |
| Median size | 1,042 sq ft | 1,147 sq ft |
| Share with no garage | 51% | 37% |
| Median days to contract, 2026 closed | 41 | 39 |
| Cut price before selling | 75% | 74% |
| Seller paid a concession | 55% | 68% |
Inventory is climbing at nearly the same rate outside Denver. Days on market are effectively tied. The share of sellers who cut their price before finding a buyer is identical at three in four. Where Denver genuinely differs: its condos are older, a median build year of 1974 versus 1995; smaller; less likely to include a garage, with half of them having none; and priced higher per finished foot, a location premium on aging stock.
There are pockets of strength, and they share a profile: newer, suburban, and garage included.
| Condo submarket | Median sale, 2026 | Days to contract | Year built |
|---|---|---|---|
| Highlands Ranch | $467,500 | 43 | 2006 |
| Golden | $521,000 | 57 | 1983 |
| Broomfield | $397,995 | 50 | 2005 |
| Parker | $357,500 | 24 | 2005 |
| Littleton | $339,150 | 36 | 1997 |
| Aurora | $262,950 | 48 | 1982 |
It is a metro-wide condo correction. Denver owns roughly half of it by volume, and its slice skews to the oldest, smallest, most amenity-light stock, the part of the market with the least pricing power.
Denver’s houses are selling. Denver’s condos are stalling.
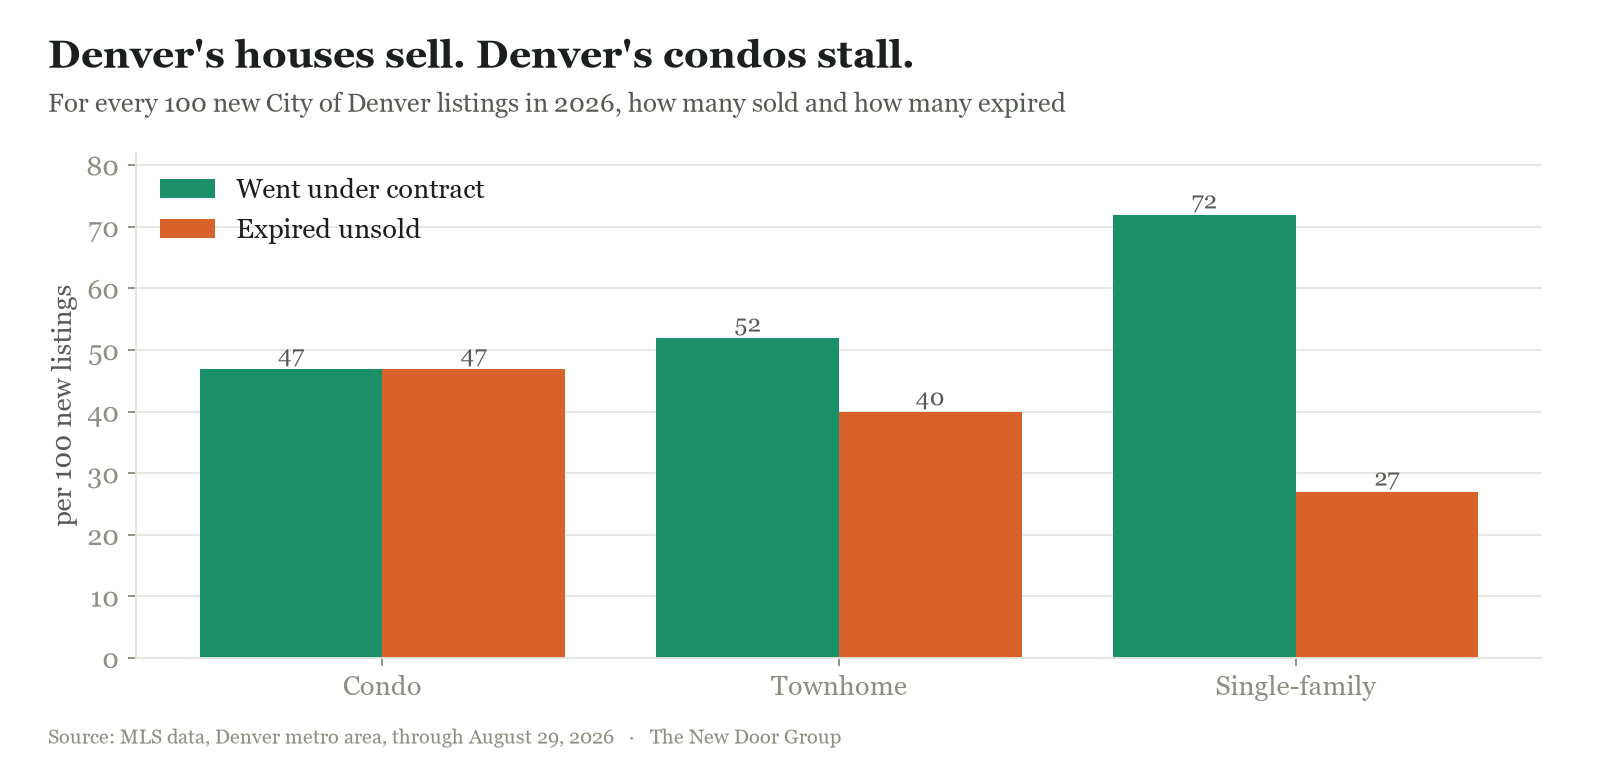
Same city, same buyers’ agents, same interest rates, and two very different markets by property type. A Denver house that lists in 2026 is about three times as likely to go under contract as to expire. A Denver condo is a coin flip: for every 100 that listed, about 47 went under contract and about 47 expired unsold. And the wait is longer. A condo takes a median of 58 days to reach contract; a house takes 26.
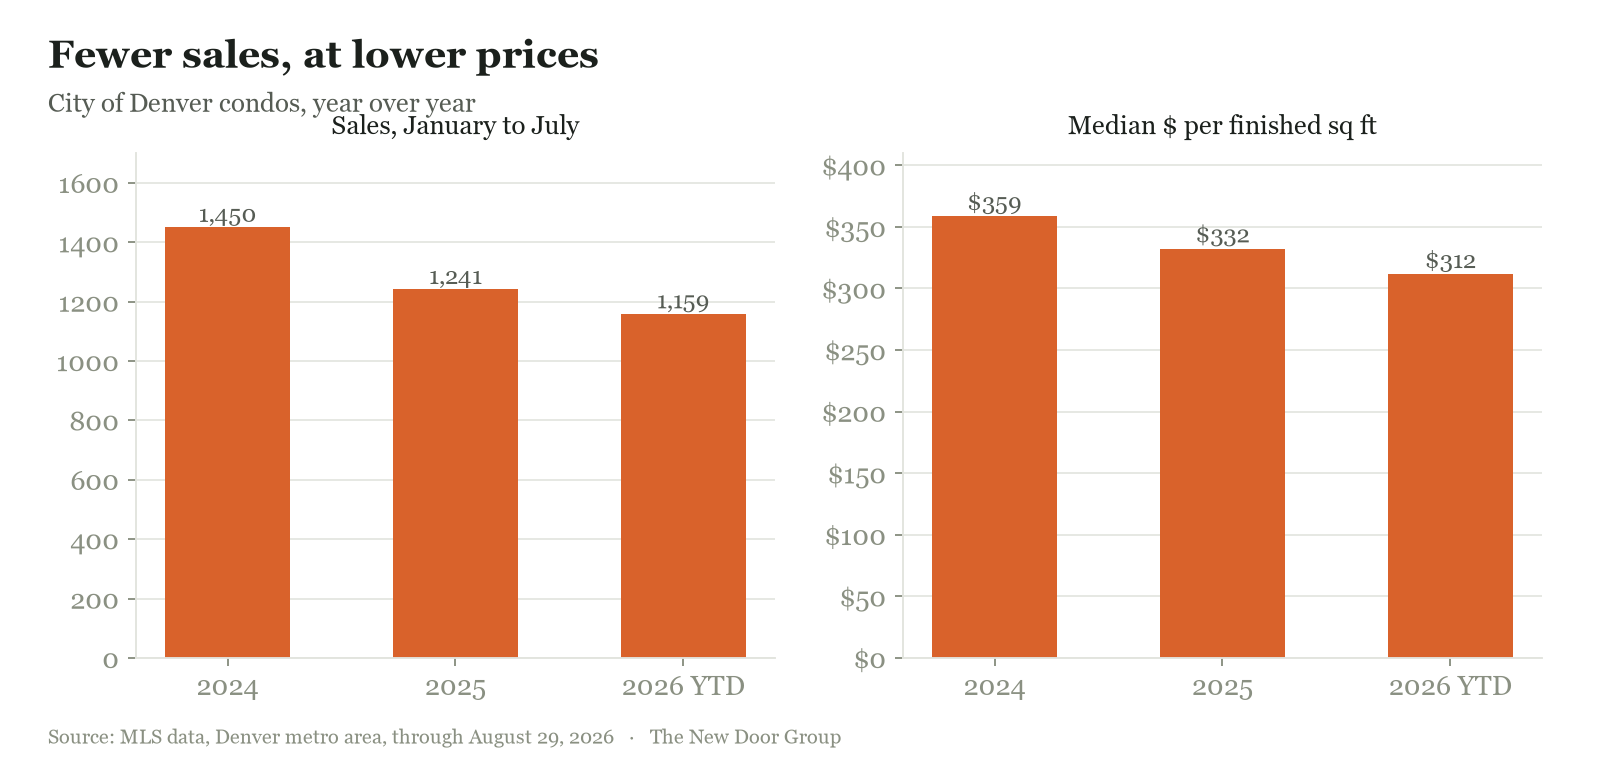
Fewer sales, at lower prices, taking longer.
Closings are the cleanest year-over-year read available. City of Denver condo sales in the first seven months of the year fell from 1,450 in 2024 to 1,241 in 2025 to 1,159 in 2026, down about 20% over two years. Median price per finished square foot fell from $359 to $332 to $312, a 13% decline, while Denver single-family prices rose over the same span. Median sale price followed the same path, from $340,000 to $325,000 to $315,000.
Across the whole metro, the pattern by property type is unmistakable: houses are healthy, townhomes are soft, condos are the clear laggard.
| Measure | Condo | Townhome | Single-family |
|---|---|---|---|
| Sales volume, annualized pace vs. 2024 | down ~3% | down ~5% | roughly flat |
| Median sale price, 2024 | $349,975 | $471,250 | $641,750 |
| Median sale price, 2026 | $324,725 | $444,500 | $652,718 |
| Median days to contract, 2024 | 26 | 20 | 19 |
| Median days to contract, 2026 | 39 | 34 | 15 |
| Sold under asking, 2024 | 66% | 59% | 61% |
| Sold under asking, 2026 | 75% | 69% | 59% |
Sellers are asking 2024 prices. Buyers are paying 2026 prices.
Follow one number, price per finished square foot, from the moment a Denver condo is listed to the moment it closes. New listings come to market asking $366 a foot. Listings that have sat a while have trimmed to $341. Homes under contract are at $315. Closed sales land at $312. Pending and closed agree within $3, so the market has already settled on the price. New sellers keep arriving 15% to 17% high, and the aged inventory is still about 9% above where deals actually clear.
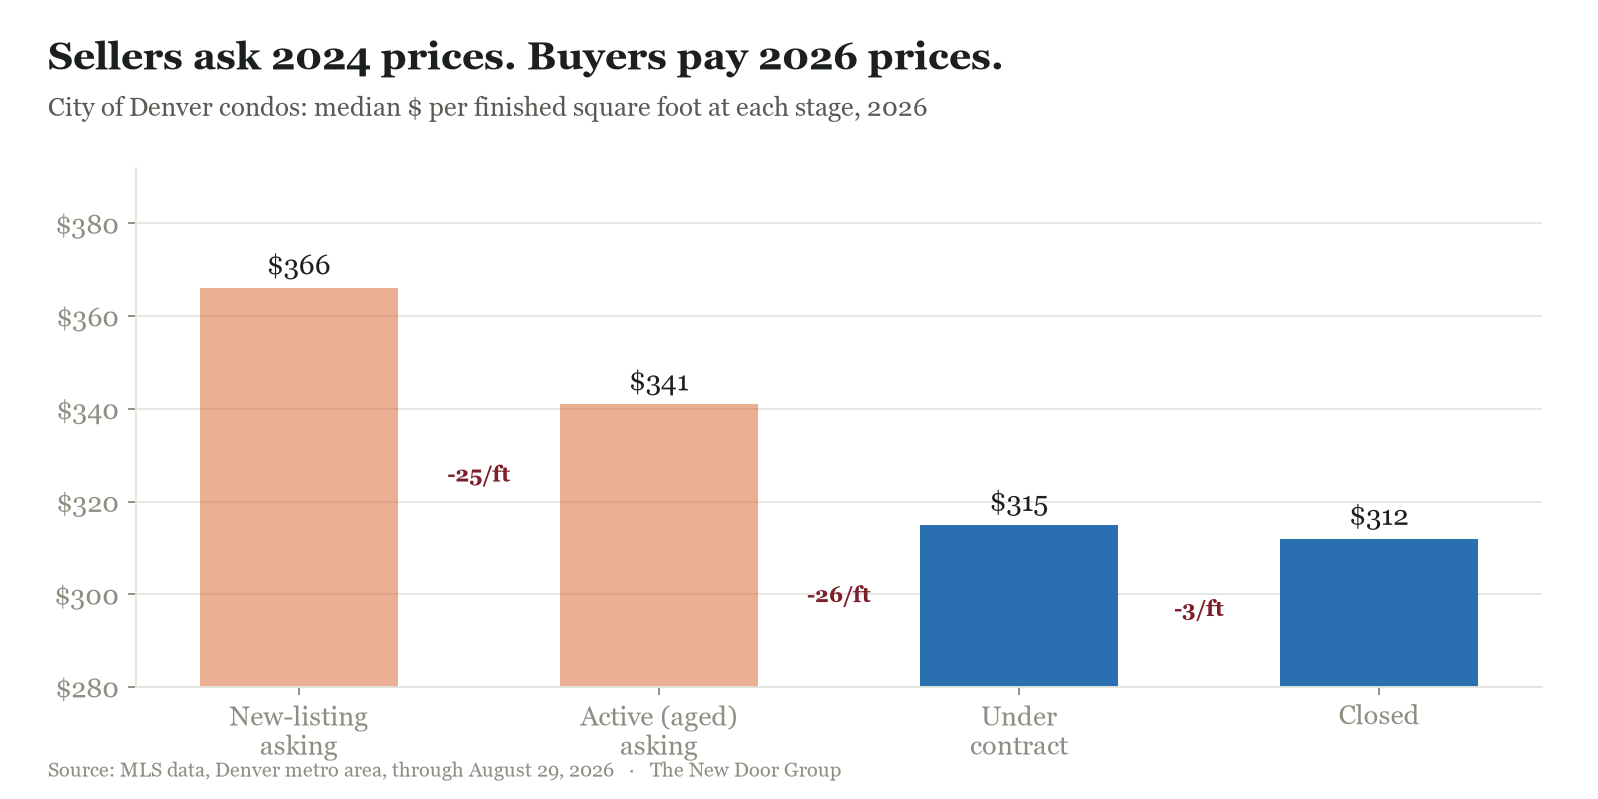
This is the most useful chart for a seller. The gap between the first two bars and the last two is the negotiation, the price cuts, the concessions, and the extra weeks on market, all of it, compressed into one picture. A condo priced at the closed number from day one skips that entire process.
When Denver condos cut, they cut deeper.
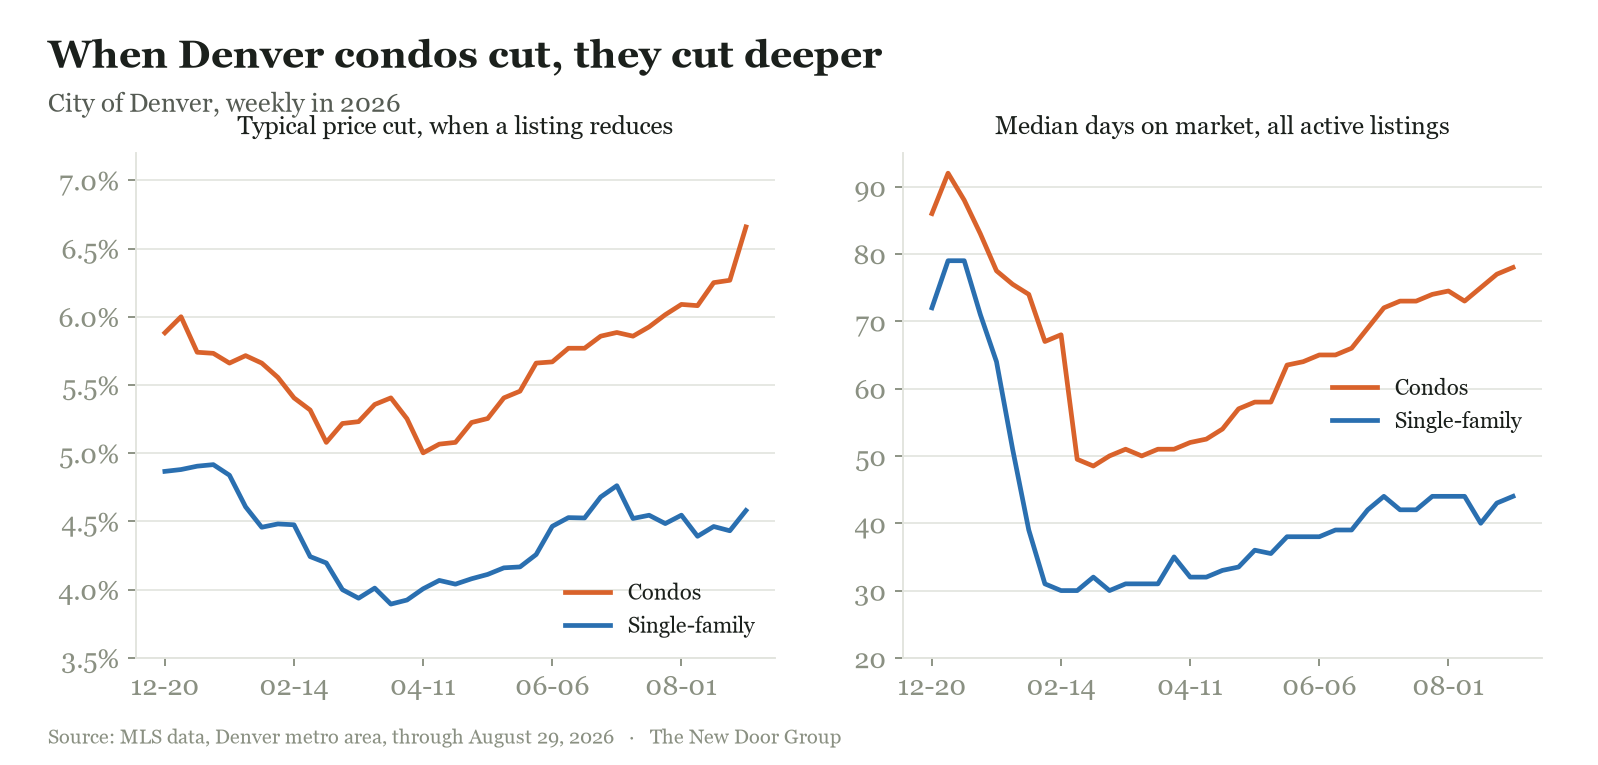
Roughly the same share of condos and houses reduce their price. The difference is how far. A Denver house that reduces trims about 4.6% off its original price. A Denver condo trims 6.7%, and that gap has widened through the year. Meanwhile, Denver’s active condo inventory has aged from a median of about 50 days on market in the spring to 78 now. Houses have held near 44.
If you are thinking about selling a Denver condo
None of this is about the market being bad. It is about pricing and presenting to the market that actually exists right now. Six moves that fit it:
- Price to the closed number, not the asking number. The data shows a 15% to 17% gap between where condos list and where they close per foot. Start where the market is and you skip the cuts, the concessions, and the extra 40 days.
- The first ten days are the whole ballgame. Comparable condos that priced right went under contract in 1 to 19 days. The ones that started high sat 60, 90, 110 days and still sold for less. There is no recovering a stale launch in this market.
- Budget for a concession before you list. More than half of Denver condo sales include a seller-paid concession. Assume 2% to 2.5% of price toward the buyer’s closing costs or rate buydown, and price with that in mind rather than meeting it as a surprise in negotiation.
- Make the HOA a selling point, not a question mark. Condo buyers in 2026 underwrite the HOA as hard as the unit. Have the budget, reserve study, insurance certificate, and any special-assessment history ready on day one. A clean HOA package is a genuine differentiator right now.
- Lead with what the competing listings lack. An updated kitchen, newer mechanicals, move-in condition, and a real garage are exactly the things half the competing inventory does not have. Photography and copy should make those the reason to choose your unit.
- Move first, and decisively, if week two is quiet. If showings are light after the first weekend, one meaningful cut in week two beats three token cuts over two months. Buyers reward a decisive reset and punish a slow bleed.
Working with the data
Selling a condo in this market is a pricing problem, not a luck problem. The gap between a condo that sells in two weeks and one that sits for three months comes down almost entirely to where it starts. The New Door Group builds this level of market analysis into every listing: the comparable sales that actually matter for your specific building, a launch price set to the closing reality rather than the asking fiction, and a plan for the first ten days on market.
To talk through what your unit would do in today’s market, reach out to The New Door Group.
This representation is based in whole or in part on content supplied by REcolorado®, Inc. REcolorado®, Inc. does not guarantee nor is it in any way responsible for its accuracy. Content maintained by REcolorado®, Inc. may not reflect all real estate activity in the market.