

Denver Metro Area | Monthly Market Update
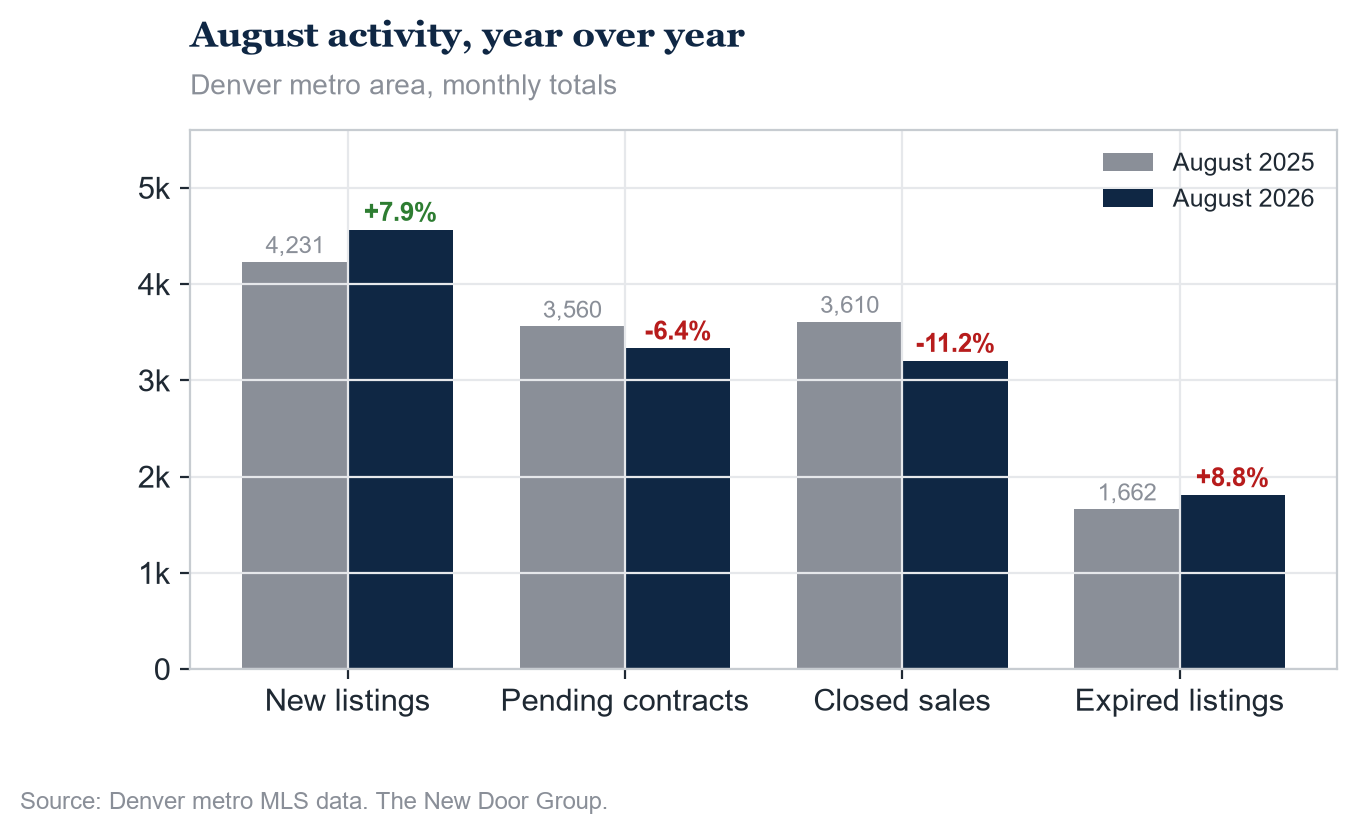
August brought more homes to the Denver-area market and fewer buyers to see them, and, so far, no move down in price. New listings ran 7.9% above a year ago, the strongest year-over-year gain of 2026, and the number of homes for sale finished the month essentially level with last August after running below it all spring. Against that added supply, pending contracts fell 6.4%, closed sales fell 11.2%, and scheduled showings fell 7.7% from a year earlier.
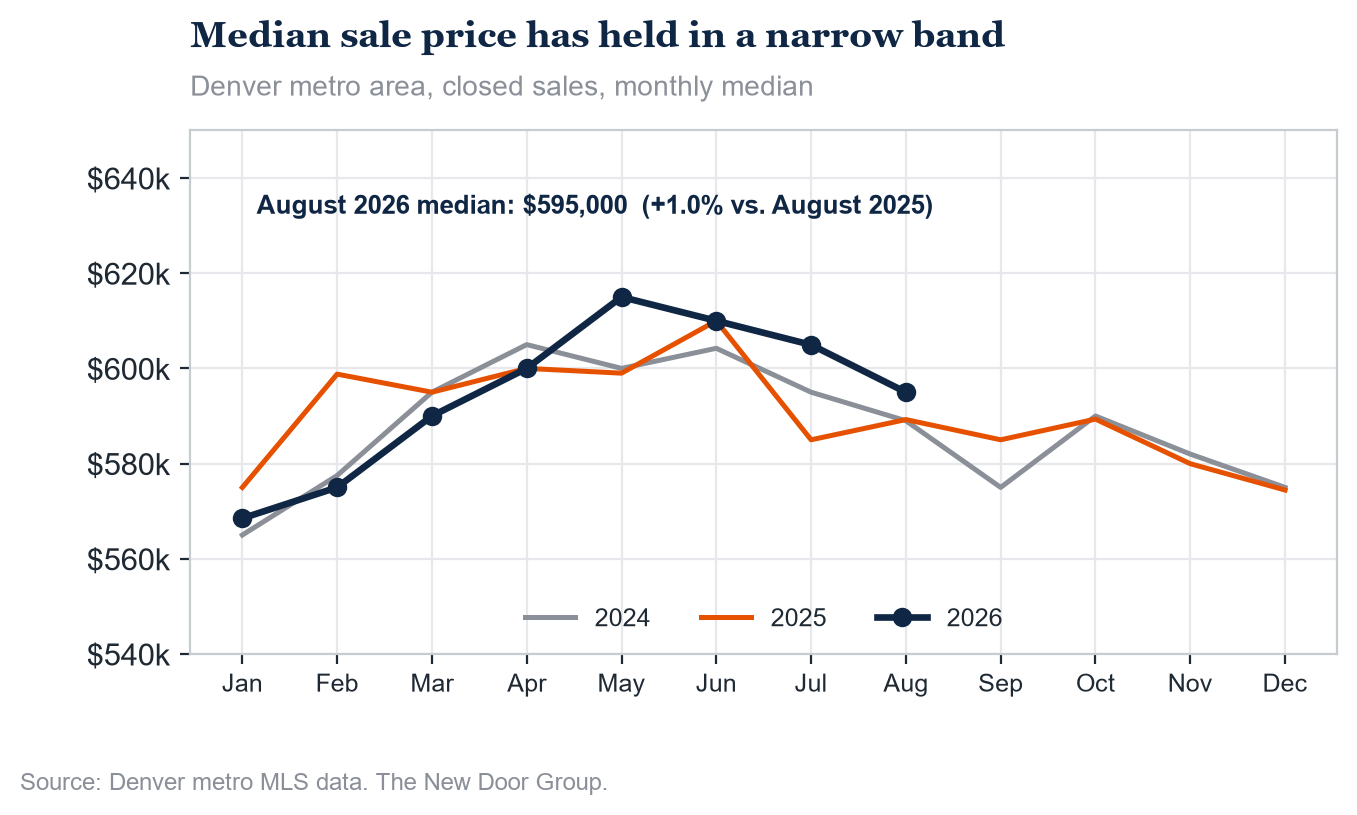
Yet the homes that did sell closed at a median of $595,000, up 1.0% from last August, in a median of 27 days to contract, down from 30. A larger share sold at or above the asking price than a year ago, and fewer sellers paid a concession. The softness in August is a volume story, not a price story.
Supply: more homes for sale, staying on the market longer
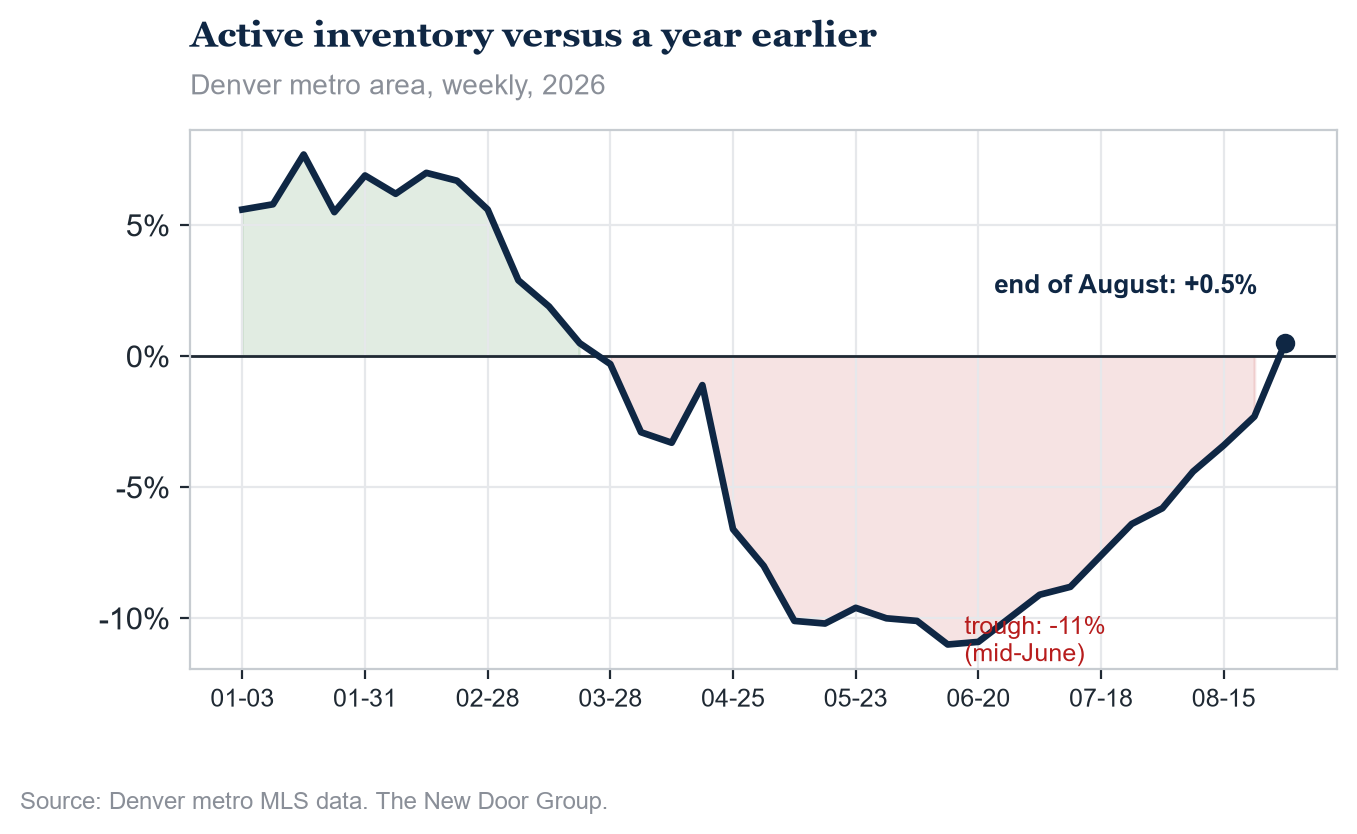
New listings totaled roughly 4,900 in August, the second straight month above year-ago levels and the strongest reading of the year. The number of active listings ended the month at about 12,800, up 0.5% from a year earlier. That is the first time the year-over-year change has not been negative since March; the gap has closed steadily from a low near -11% in mid-June, as this year’s inventory kept building while last year’s had already started its autumn decline.
Expired listings, homes that came off the market without selling, totaled about 1,800 in August, up 8.8% year over year. Expirations remain elevated: about one listing now expires for every 2.5 new listings that arrive, against roughly one in 4.5 two years ago. Year to date, though, expirations are running slightly below 2025, so August’s increase is a monthly uptick on an already-high base rather than a fresh escalation.
Demand: fewer buyers touring, fewer contracts written
Pending contracts totaled about 3,500 in August, down 6.4% from a year ago and below year-ago levels in four of the last five months. Closed sales came in at 3,205, down 11.2% from August 2025 and the weakest August of the current cycle. Because an August closing usually reflects a contract signed in June, that number reads through directly from the early-summer dip in demand.
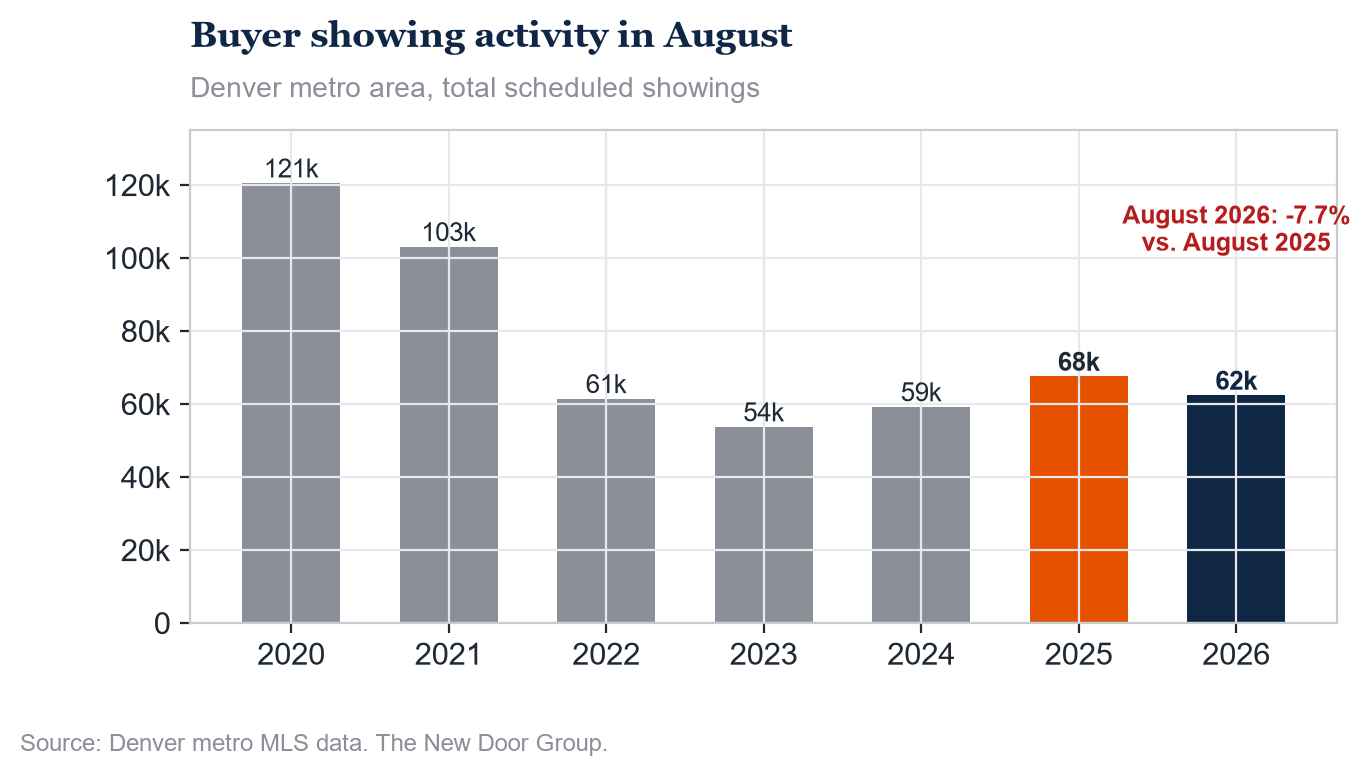
Scheduled buyer showings totaled 62,413, down 7.7% year over year. That is mid-pack for an August in the multi-year record, above 2022, 2023 and 2024 but below 2025. All three demand measures peaked in spring and have drifted lower through the summer.
Price: still slightly higher than a year ago
The median closed price in August was $595,000, up 1.0% from $589,250 in August 2025. The metro median has held within a band of roughly $585,000 to $615,000 all year. By property type, the August median was $649,250 for a single-family home, $445,000 for a townhome, and $315,000 for a condominium.
At the negotiating table, buyers still lead, by a slimmer margin
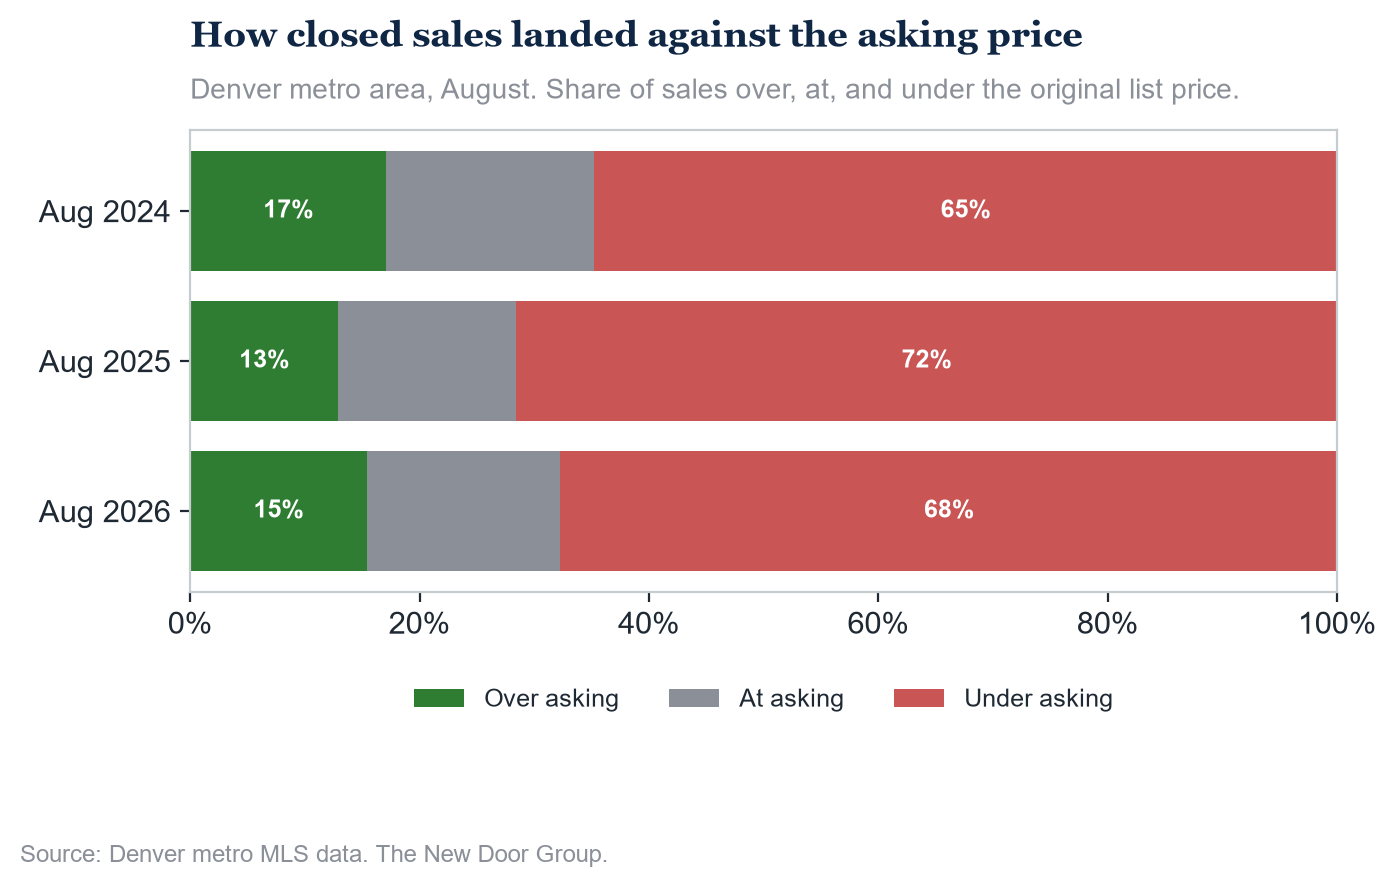
Of the homes that closed in August, 15.4% sold above the original asking price, up from 12.9% a year ago, and 67.9% sold below asking, down from 71.6%. About 61% of sales included a seller-paid concession, down from 63.5% a year ago; where paid, the typical concession was about 1.9% of the price. The median sale closed at 97.5% of the original list price, up from 96.9%. Buyers still have the better position, but marginally less so than a year ago.
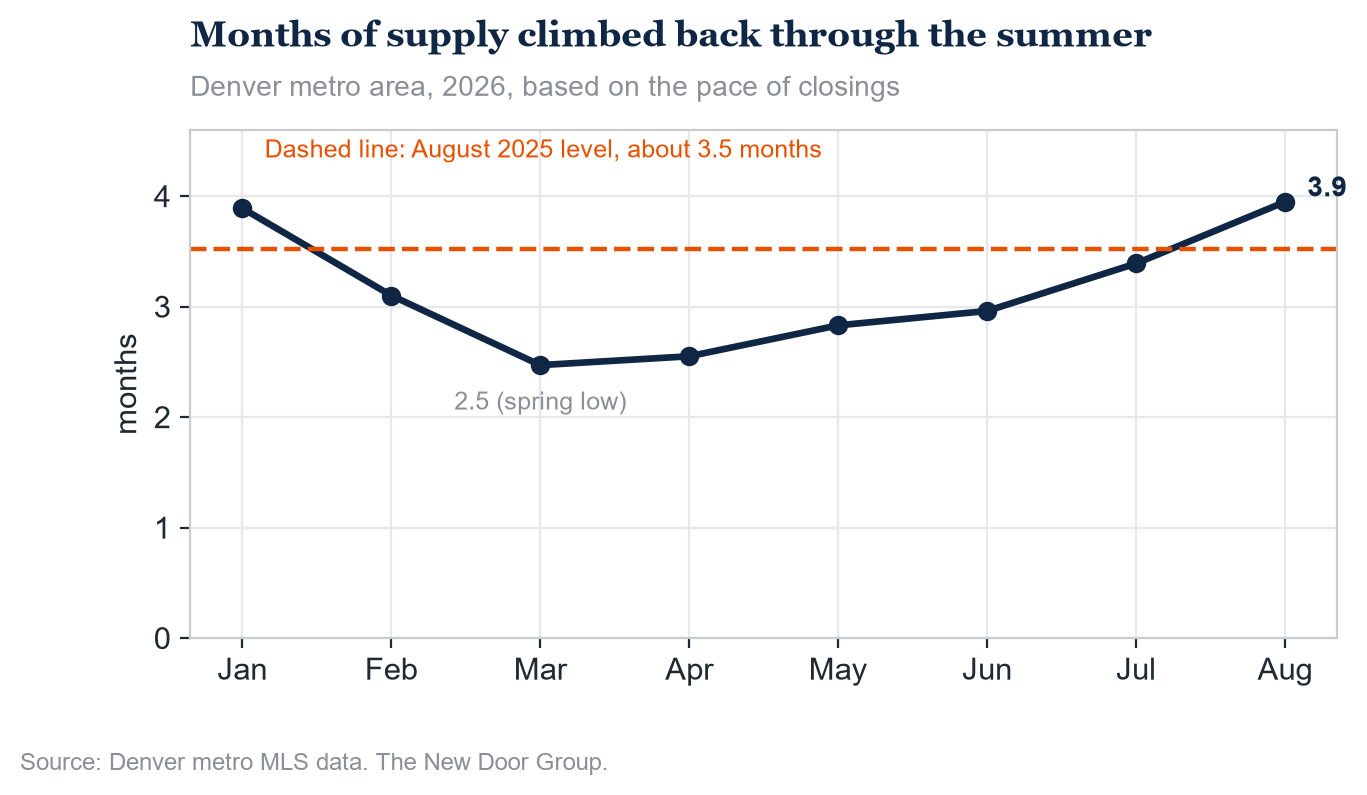
Months of supply have climbed back through the summer
Homes went under contract in a median of 27 days in August, faster than a year ago but slower than the spring low of 14. Months of supply, measured against the pace of closings, rose to just under 4.0, from about 3.5 a year ago and a spring low of 2.5. That is more inventory relative to sales, but still short of the five to six months usually considered a balanced market. By property type it runs about 3.2 months for single-family homes, 5.3 for townhomes, and 7.7 for condominiums.
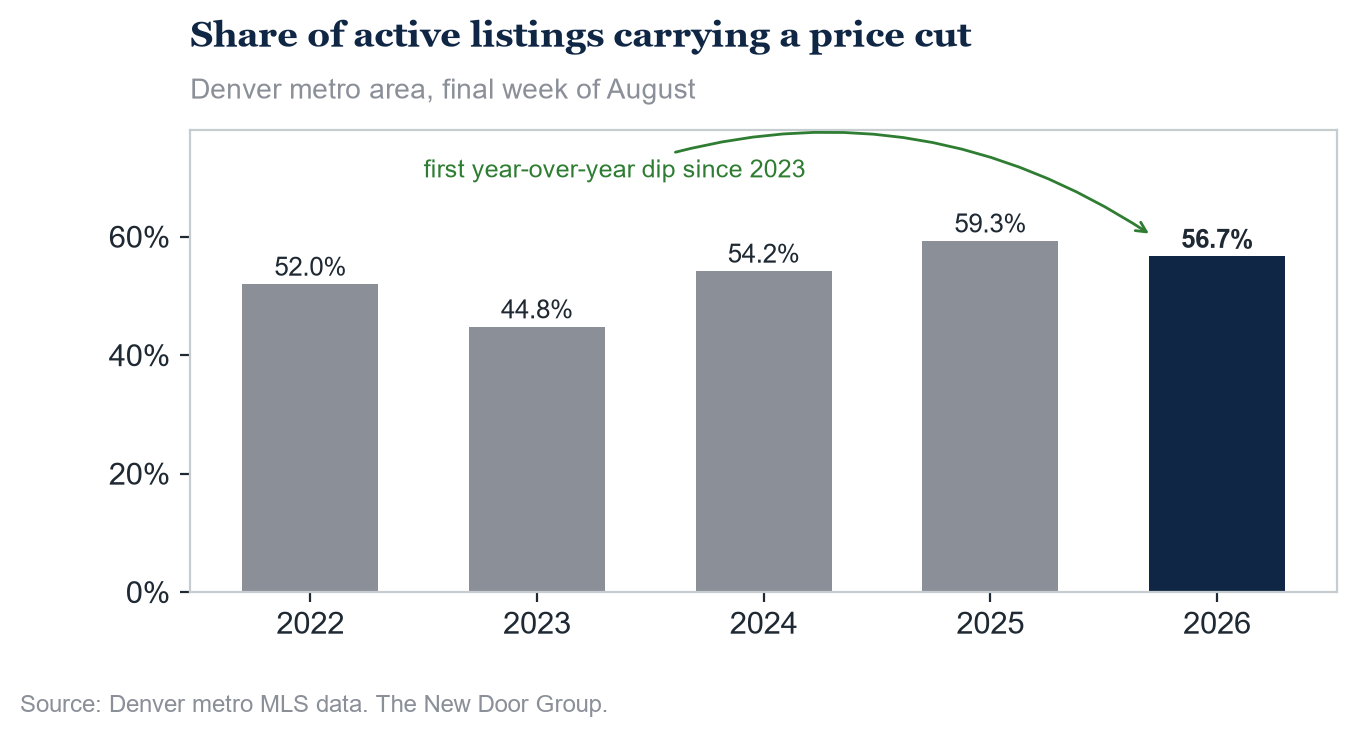
Fewer listings are carrying a price cut
At the end of August, 56.7% of active listings had reduced their price at least once, down from 59.3% a year ago. That is the first year-over-year decline in this measure since 2023. Among listings that did cut, the median reduction was about $25,000, or 4.4% of the original price. Read alongside the firmer list-to-close ratios, this suggests new listings are coming to market somewhat more realistically priced than they were a year ago.
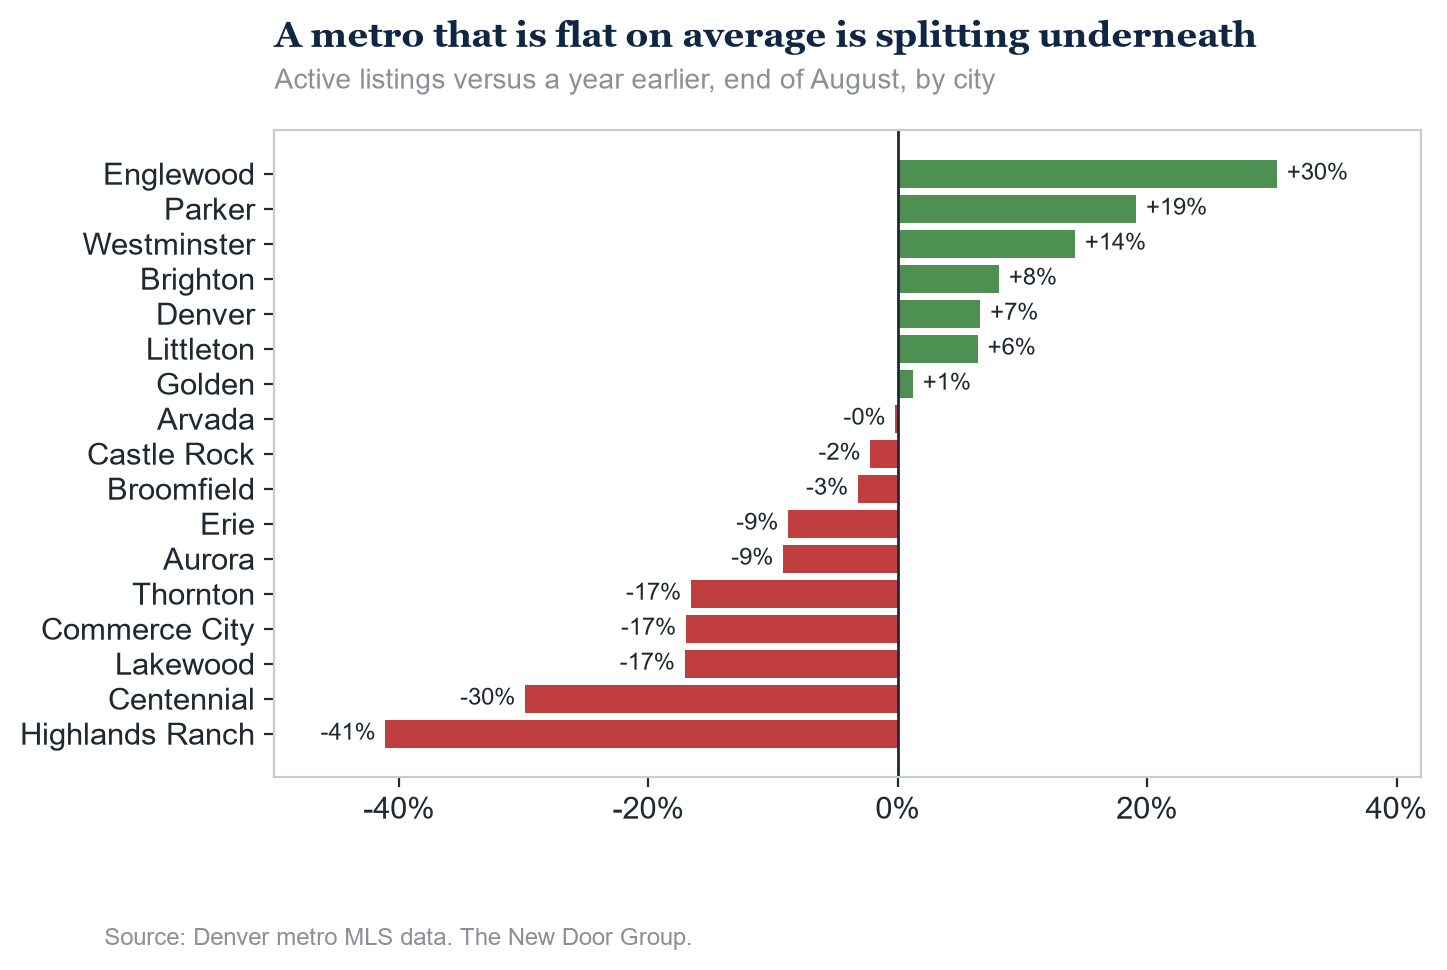
A metro that looks flat is splitting underneath
The flat metro inventory figure hides a wide range across cities. Ending August, active listings were up sharply from a year ago in Englewood (+30%), Parker (+19%) and Westminster (+14%), and up mid-single digits in Denver, Brighton and Littleton. They were down sharply in Highlands Ranch (-41%) and Centennial (-30%), and down 15% to 17% in Thornton, Lakewood and Commerce City.
Months of supply by city runs from about 2.4 in Highlands Ranch and 2.8 in Thornton to 5.3 in Englewood and 5.4 in the City of Denver. Denver, the largest single submarket, is also among the slowest, in line with the condominium concentration covered in our recent reporting. On the other side, Golden stands out: a median close near $990,000 in a median of just 14 days.
What it means
The direction is consistent: more homes for sale, fewer buyers touring and contracting, and a supply-to-demand balance that has loosened for six straight months. Months of supply near 4.0 is the highest for an August in the current cycle.
So far, the market is absorbing that shift without a price correction. The median sale price is higher than a year ago, homes still go under contract in under a month, a larger share sell at or above asking, and fewer active listings are having to cut. Sellers who price to today’s market are transacting on terms modestly better than August 2025. The penalty is landing on listings that start too high, which is where the rising expiration count is concentrated.
The risk to watch is the gap itself. Showings and contracts have trailed year-ago levels for most of the summer while inventory has climbed back to flat. If that pattern holds into the fall, months of supply keeps rising, and pressure that has so far stayed off price begins to reach it. For now, August reads as a cooler, fuller market rather than a cheaper one.
If you are weighing a move this fall, reach out to The New Door Group for a read on what your home would do in today’s market, and what the buyers you would be competing with are actually paying.
The New Door Group with Coldwell Banker.
Denver Metro Area, as used here, means: Arvada, Aurora, Brighton, Broomfield, Castle Rock, Centennial, Cherry Hills Village, Commerce City, Conifer, Dacono, Denver, Edgewater, Englewood, Erie, Evergreen, Federal Heights, Firestone, Frederick, Golden, Greenwood Village, Henderson, Highlands Ranch, Lafayette, Lakewood, Littleton, Lochbuie, Lone Tree, Louisville, Morrison, Northglenn, Parker, Sheridan, Superior, Thornton, Westminster, and Wheat Ridge.
Based on information from REcolorado®, Inc. for the period August 2025 through August 2026. This representation is based in whole or in part on content supplied by REcolorado®, Inc. REcolorado®, Inc. does not guarantee nor is it in any way responsible for its accuracy. Content maintained by REcolorado®, Inc. may not reflect all real estate activity in the market.