

The Federal Reserve raised interest rates this week, the 10-year Treasury yield closed above 5% for the first time since 2007, and 30-year mortgage rates reached their highest level in nearly 20 months. Buyers noticed: showings failed to bounce back after Labor Day the way they did last year, and the demand side of the market is now softer than it looked a week ago. None of this is a reason to panic, but it is a set of real, connected pressures that deserve a plain and professional explanation, starting with why we believe this rate environment is not a short-term spike. That continues the thread from last week’s update.
7.20%: Mortgage Rates Reach a 20-Month High
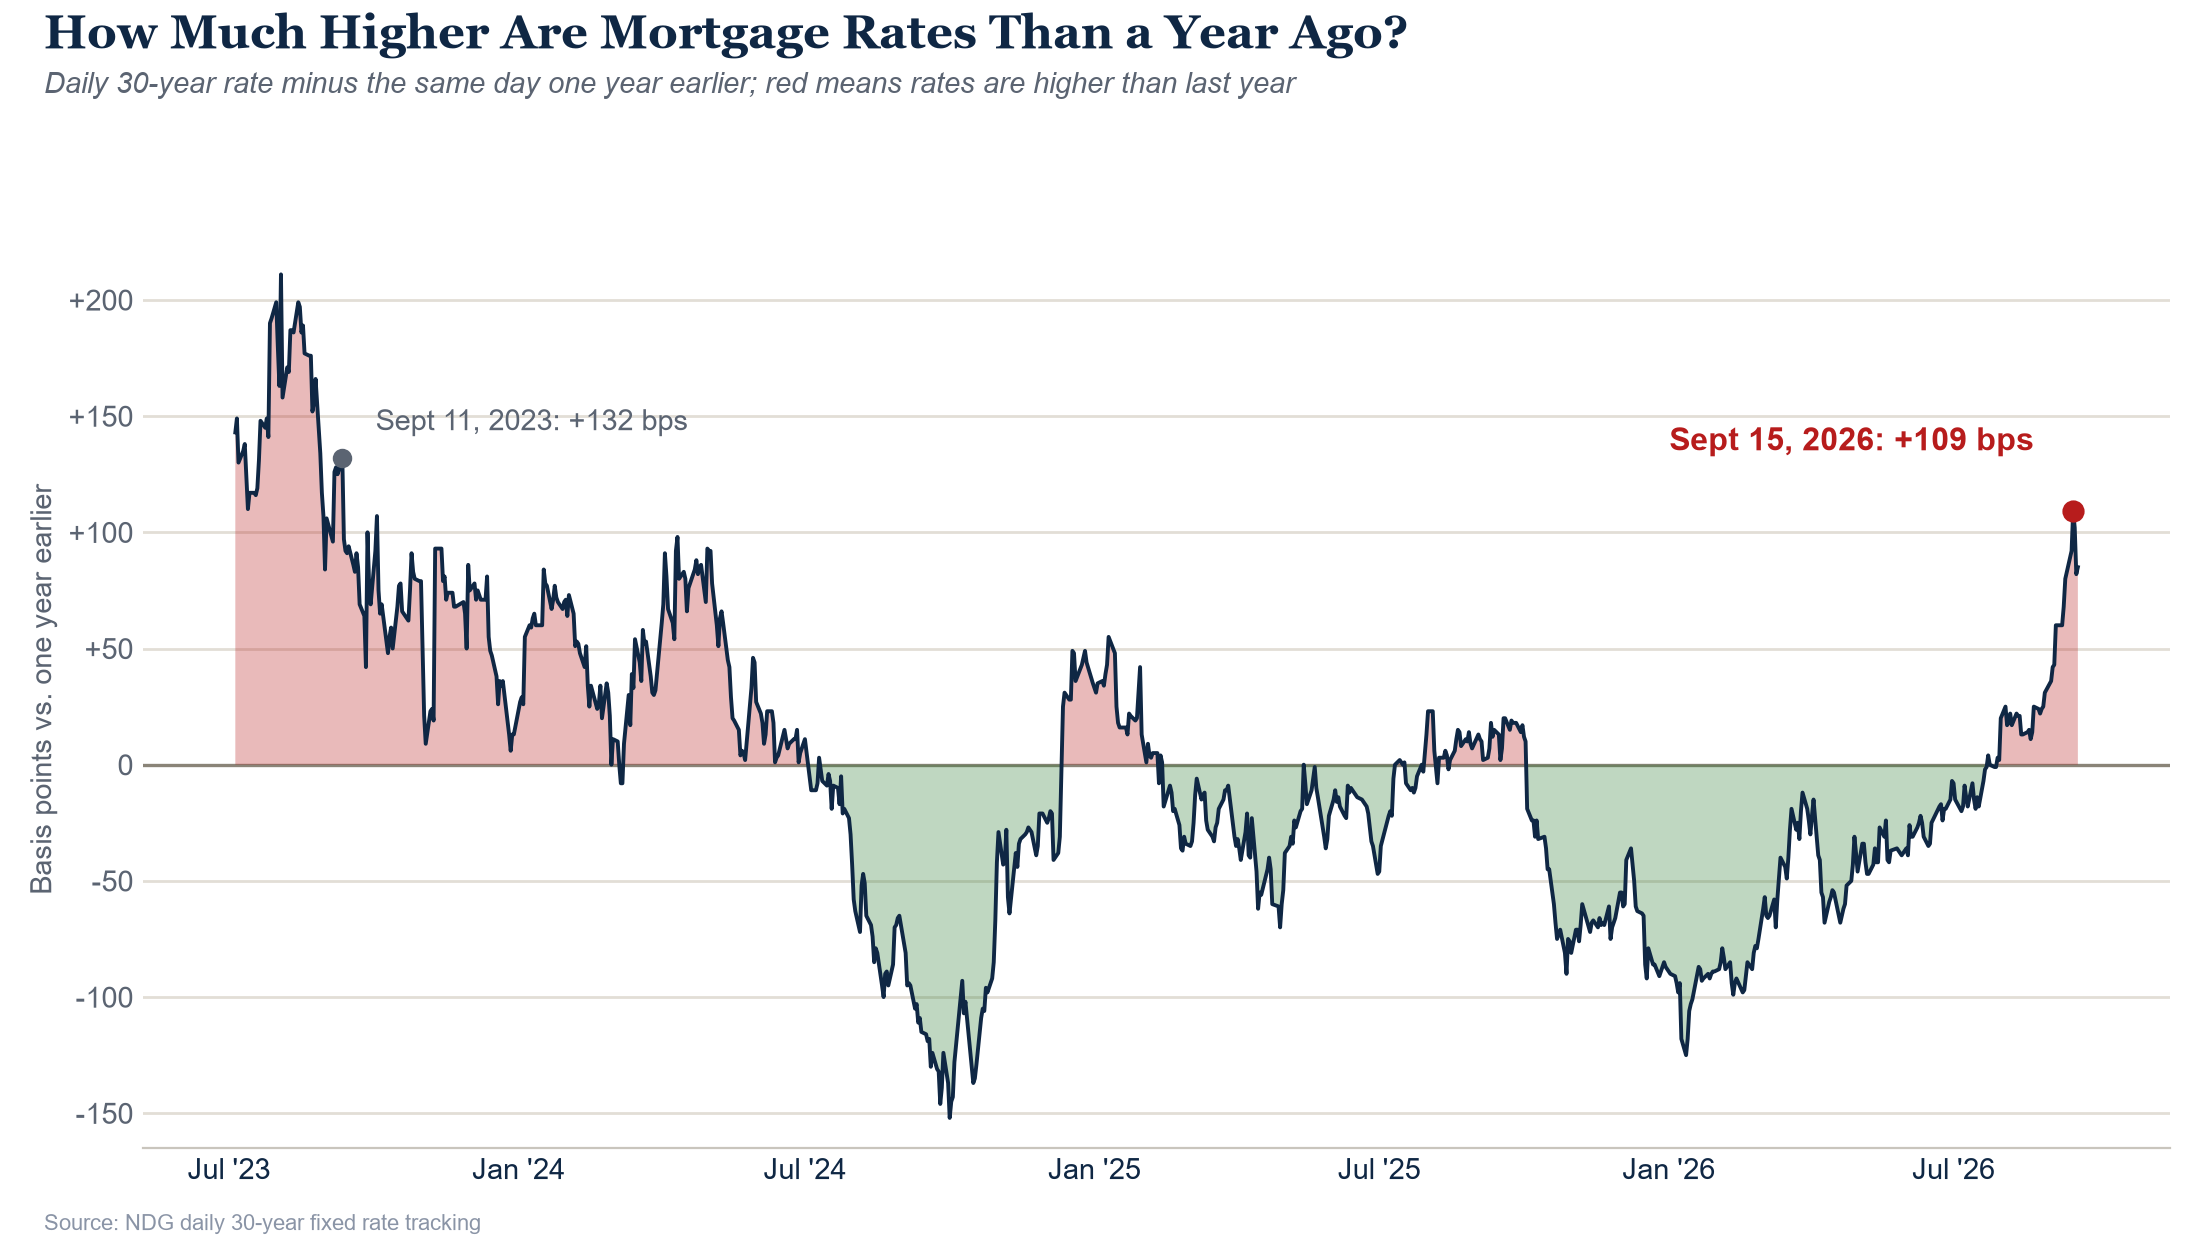
Rates climbed 35 basis points in six trading days, from 6.89% on Tuesday, Sept 8 to 7.24% on Wednesday, Sept 16, the fastest six-day rise since April 2025. Then the Fed acted, raising the federal funds rate a quarter point to 3.75%-4.00%, its first increase since 2023, and rates barely moved on Thursday or Friday because the move was fully expected. The week’s average of 7.20% is the highest weekly average since May 2024. Rates now sit 121 basis points above their 2026 low of 5.99% on Feb 23, 105 basis points above two years ago, and 85 above a year ago at the Friday close. Only three years ago, in the fall of 2023, they were still 19 basis points higher than today, on the way to 8.03% that October.
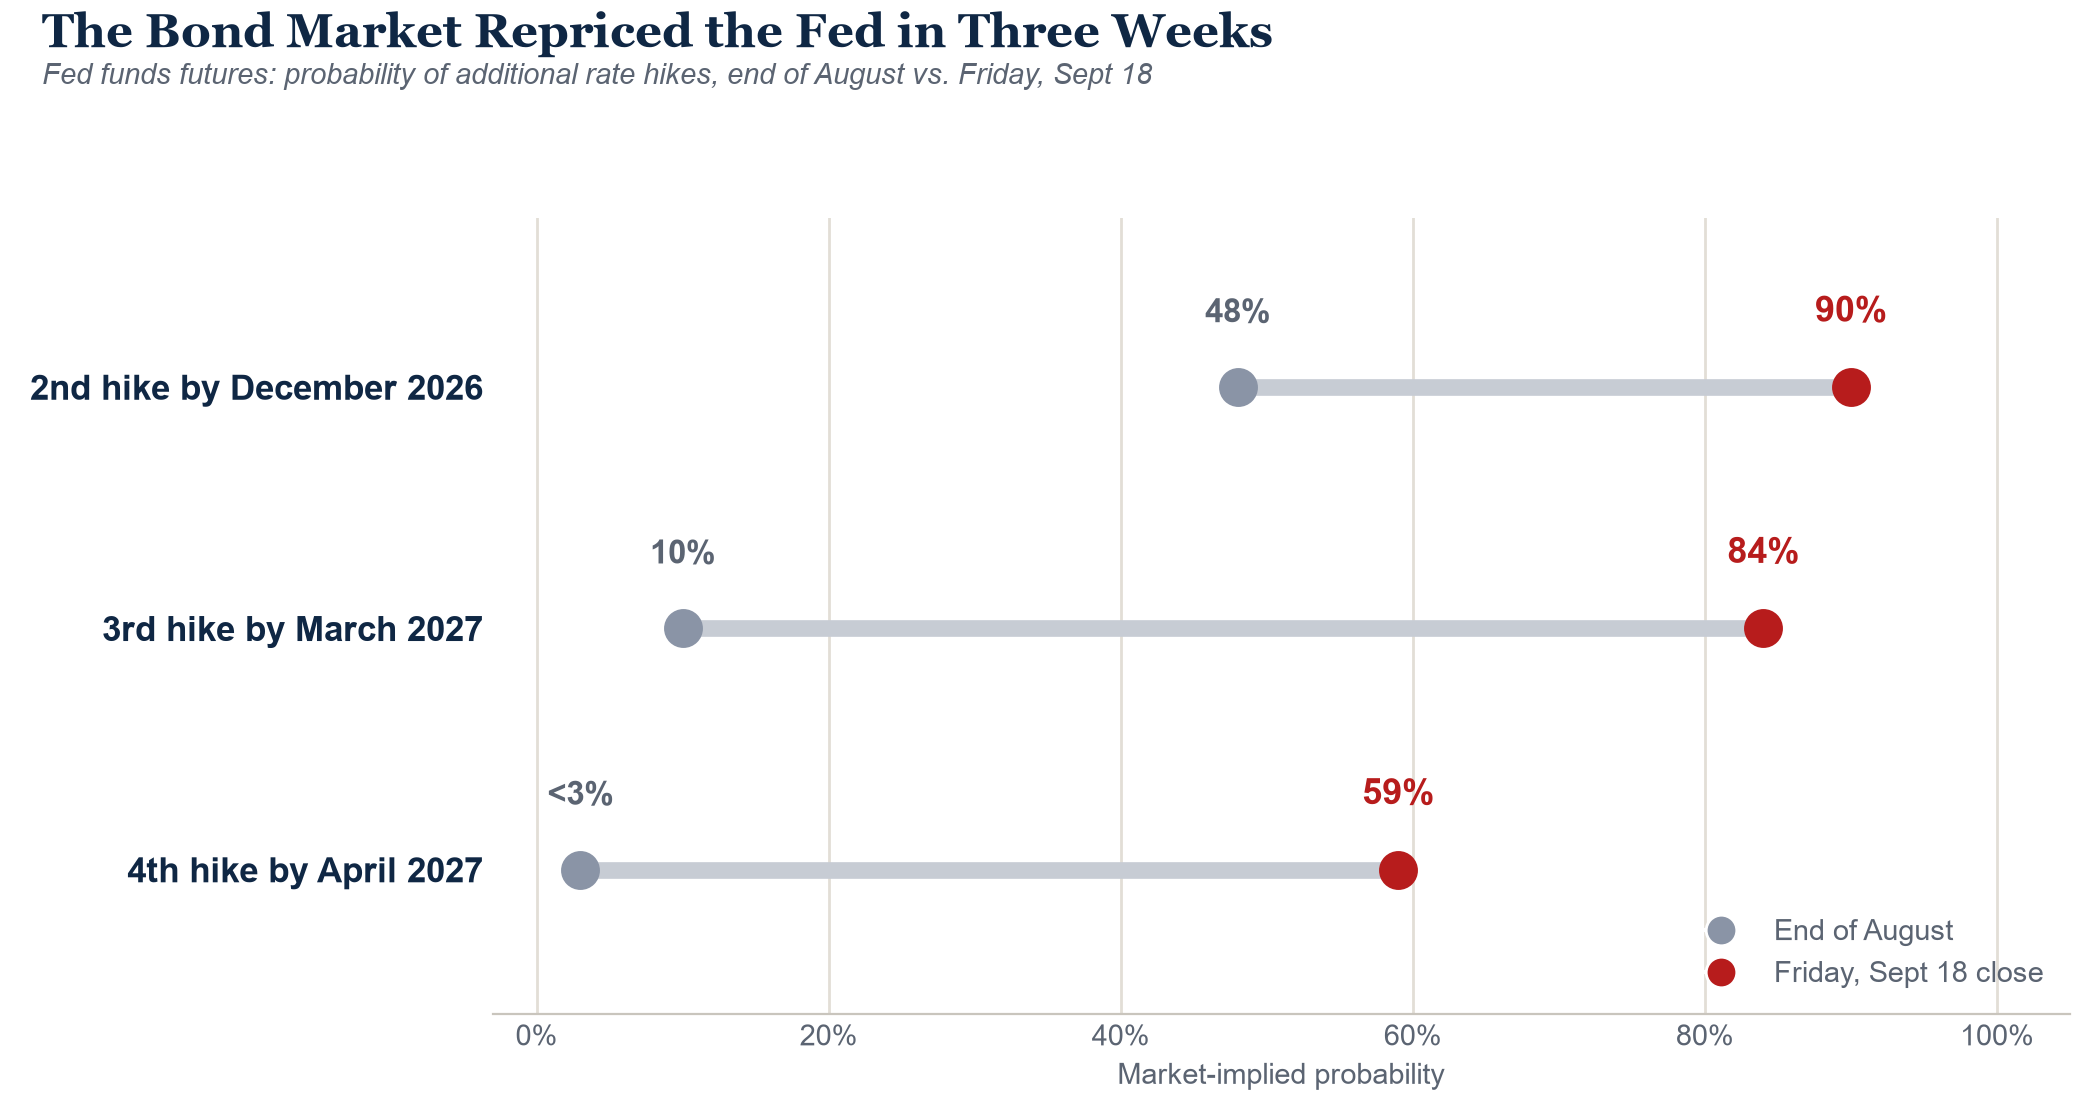
The Fed hike itself is not the story. The story is that the war with Iran has dragged on far longer than anyone expected, and higher oil and energy costs are working their way into nearly every corner of the economy. Fed Chair Kevin Warsh acknowledged this week that inflation remains too high. Mortgage rates follow the 10-year Treasury, and the 10-year trades on what the bond market expects the Fed to do next. Those expectations have been missed, badly. At the end of August, futures markets, as tracked by the CME Group FedWatch tool, put the odds of a second hike by December at 48%, a third by March 2027 at 10%, and a fourth by April at under 3%. As of Friday’s close, a second hike is close to certain at 90%, a third by March is 84% (63% as early as January), and a fourth by April is 59%. That repricing is what pushed the 10-year above 5% this week, closing at 5.00% on Sept 15 and 5.01% on Sept 16, its first close at or above 5% since July 2007, and it is what keeps the 10-year high for longer.
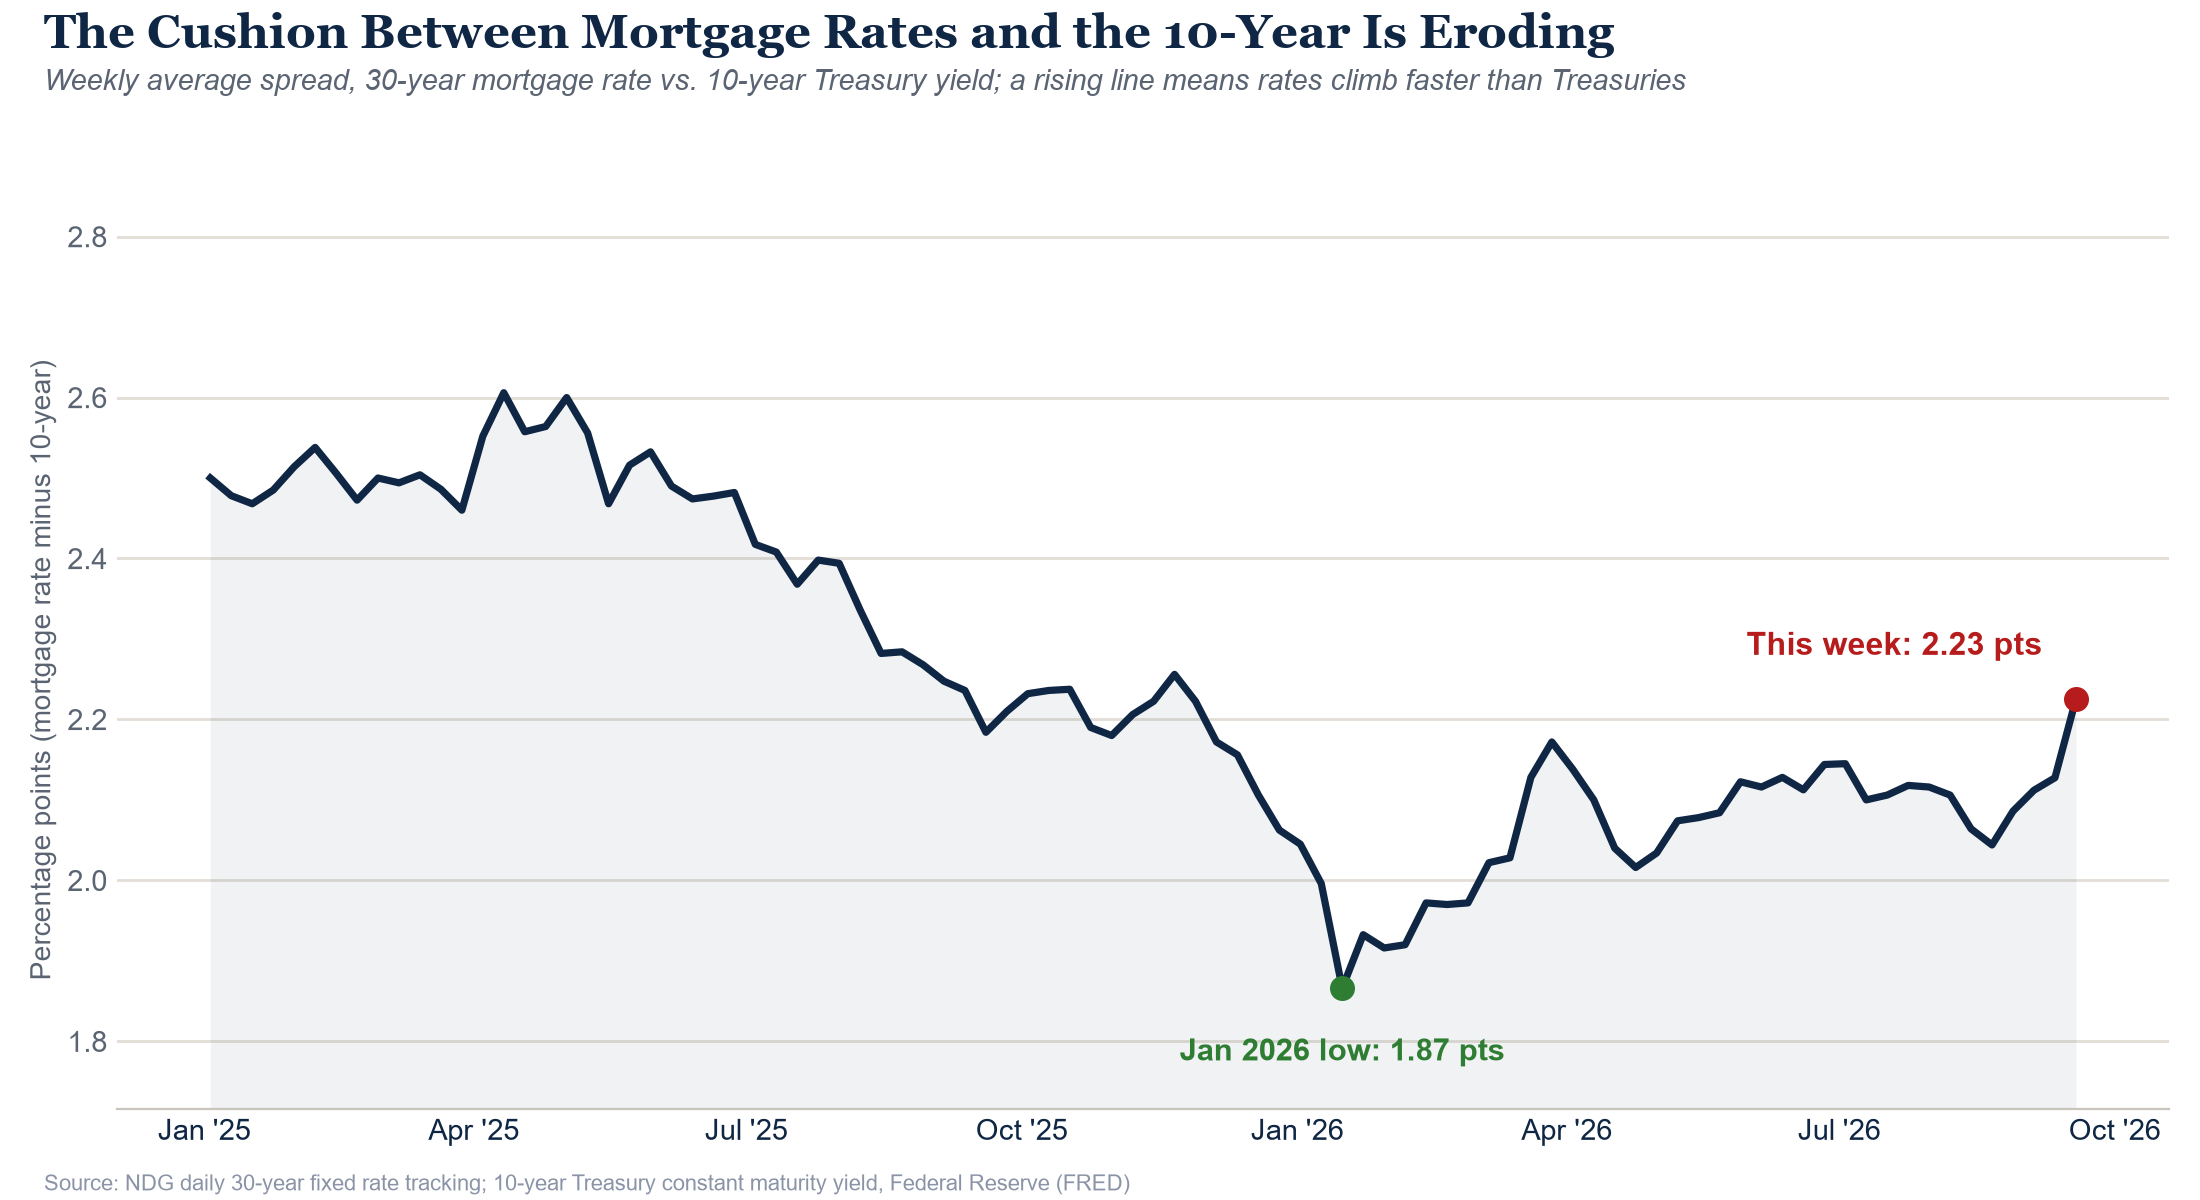
A second force is building underneath the 10-year. A mortgage rate is the 10-year yield plus a spread, and that spread has been widening. On our tracking it fell to 1.87 points in January and has climbed to 2.23 this week, including roughly another 12 basis points over the last two months. That still leaves it well short of 2023, when the spread on Freddie Mac’s weekly survey averaged 2.85 points, about two-thirds wider than the 1.72-point average of 2003 through 2019, and rates came within a whisker of 8%. But a wider spread raises mortgage rates no matter where the 10-year goes. As simple arithmetic rather than a forecast: a 5% 10-year plus a 2023-sized spread of roughly 3 points is a rate near 8%.
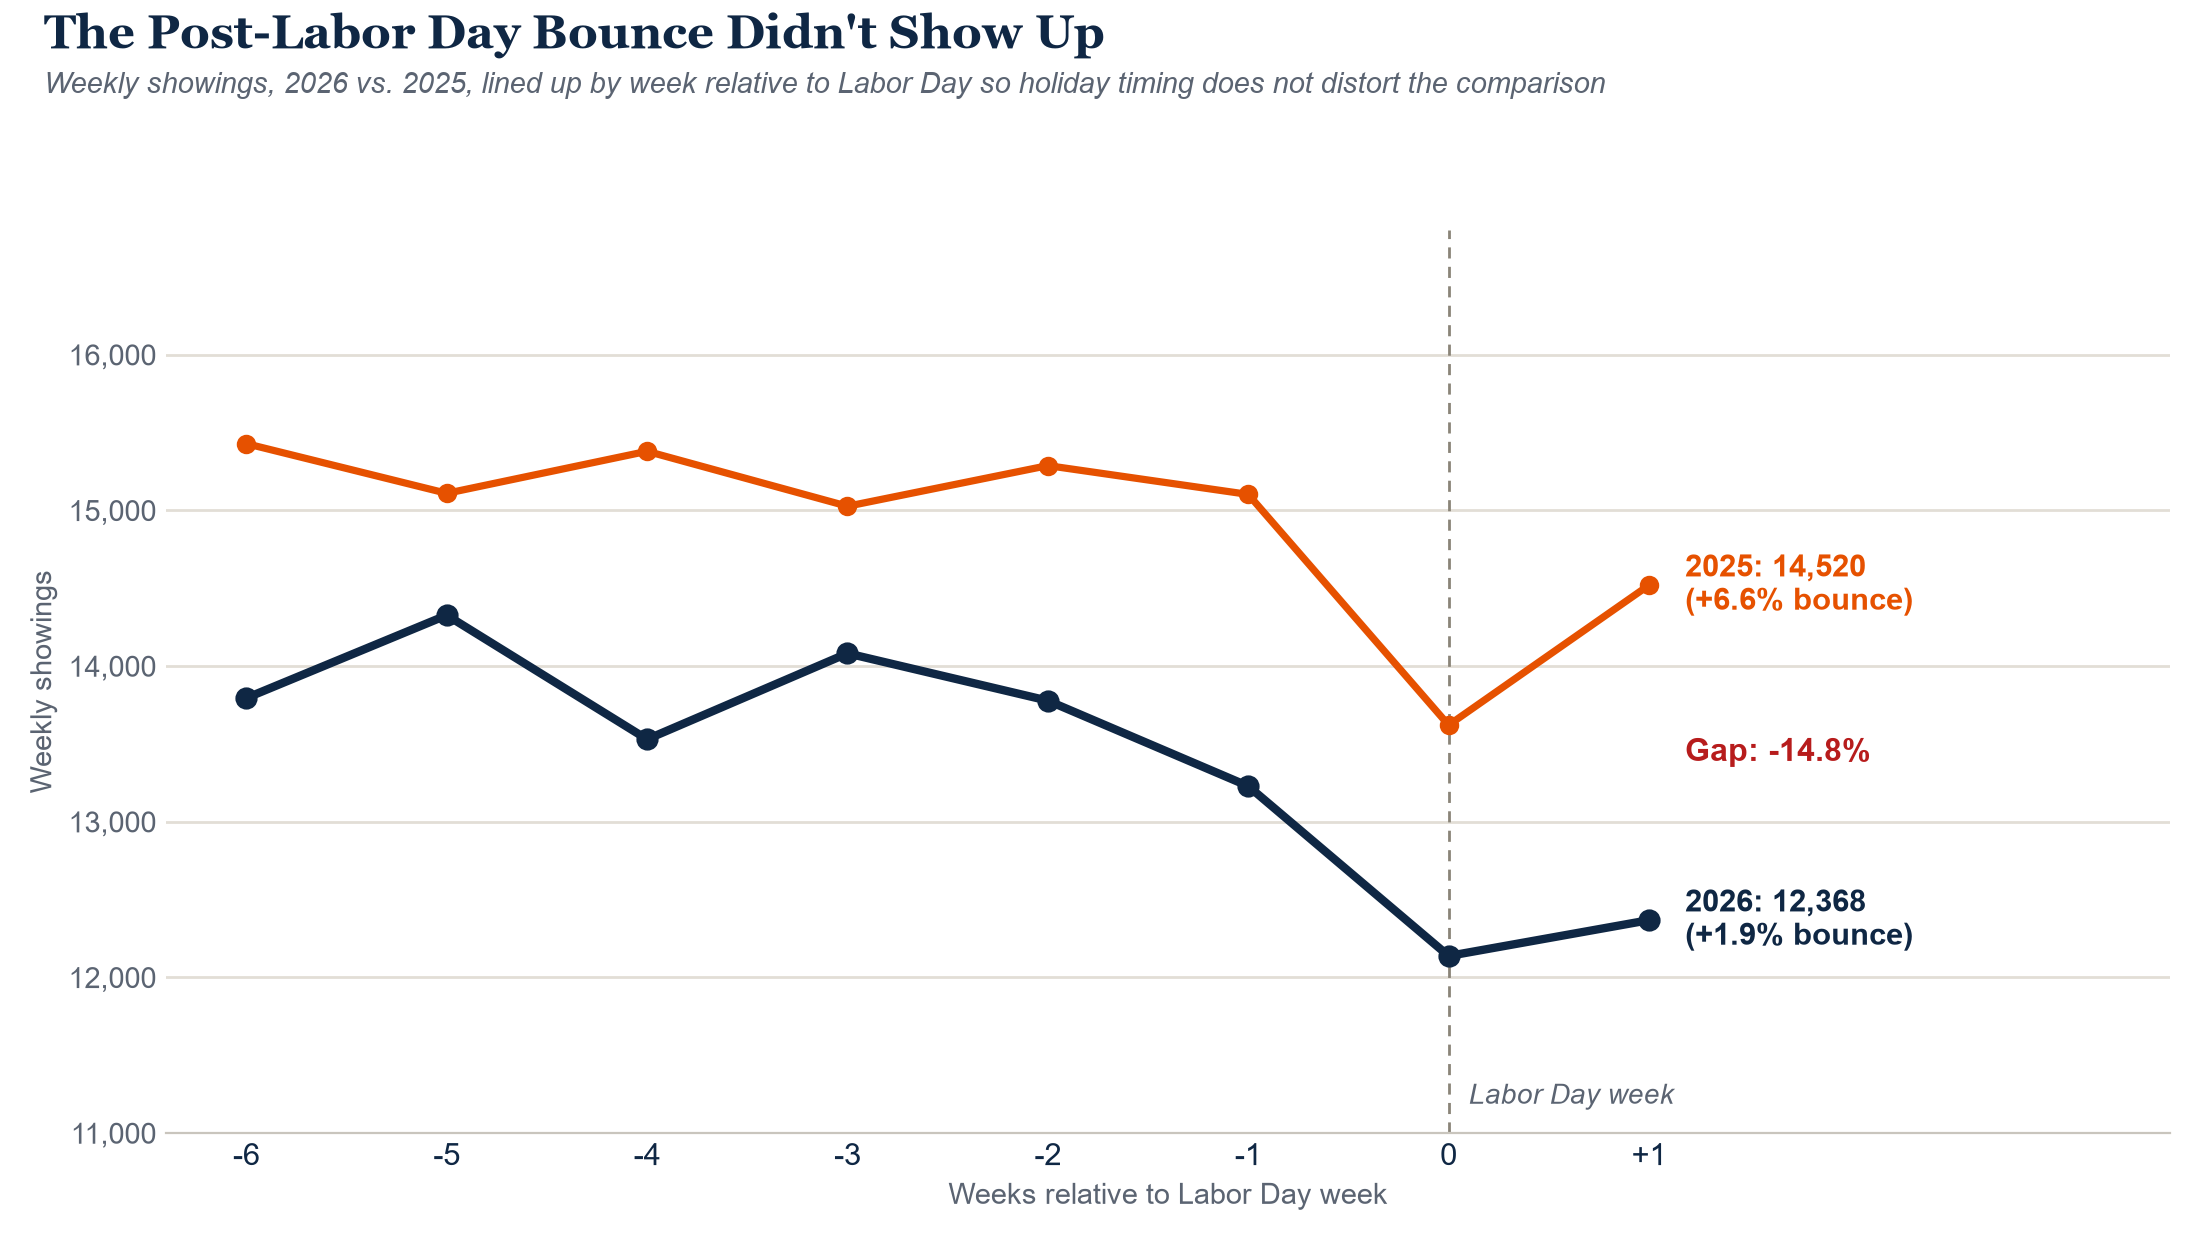
12,368 Showings: No Post-Labor Day Bounce
717 New Contracts: Last Week’s Resilience Faded
539 Closings: A Holiday Week, but the Deficit Is Real
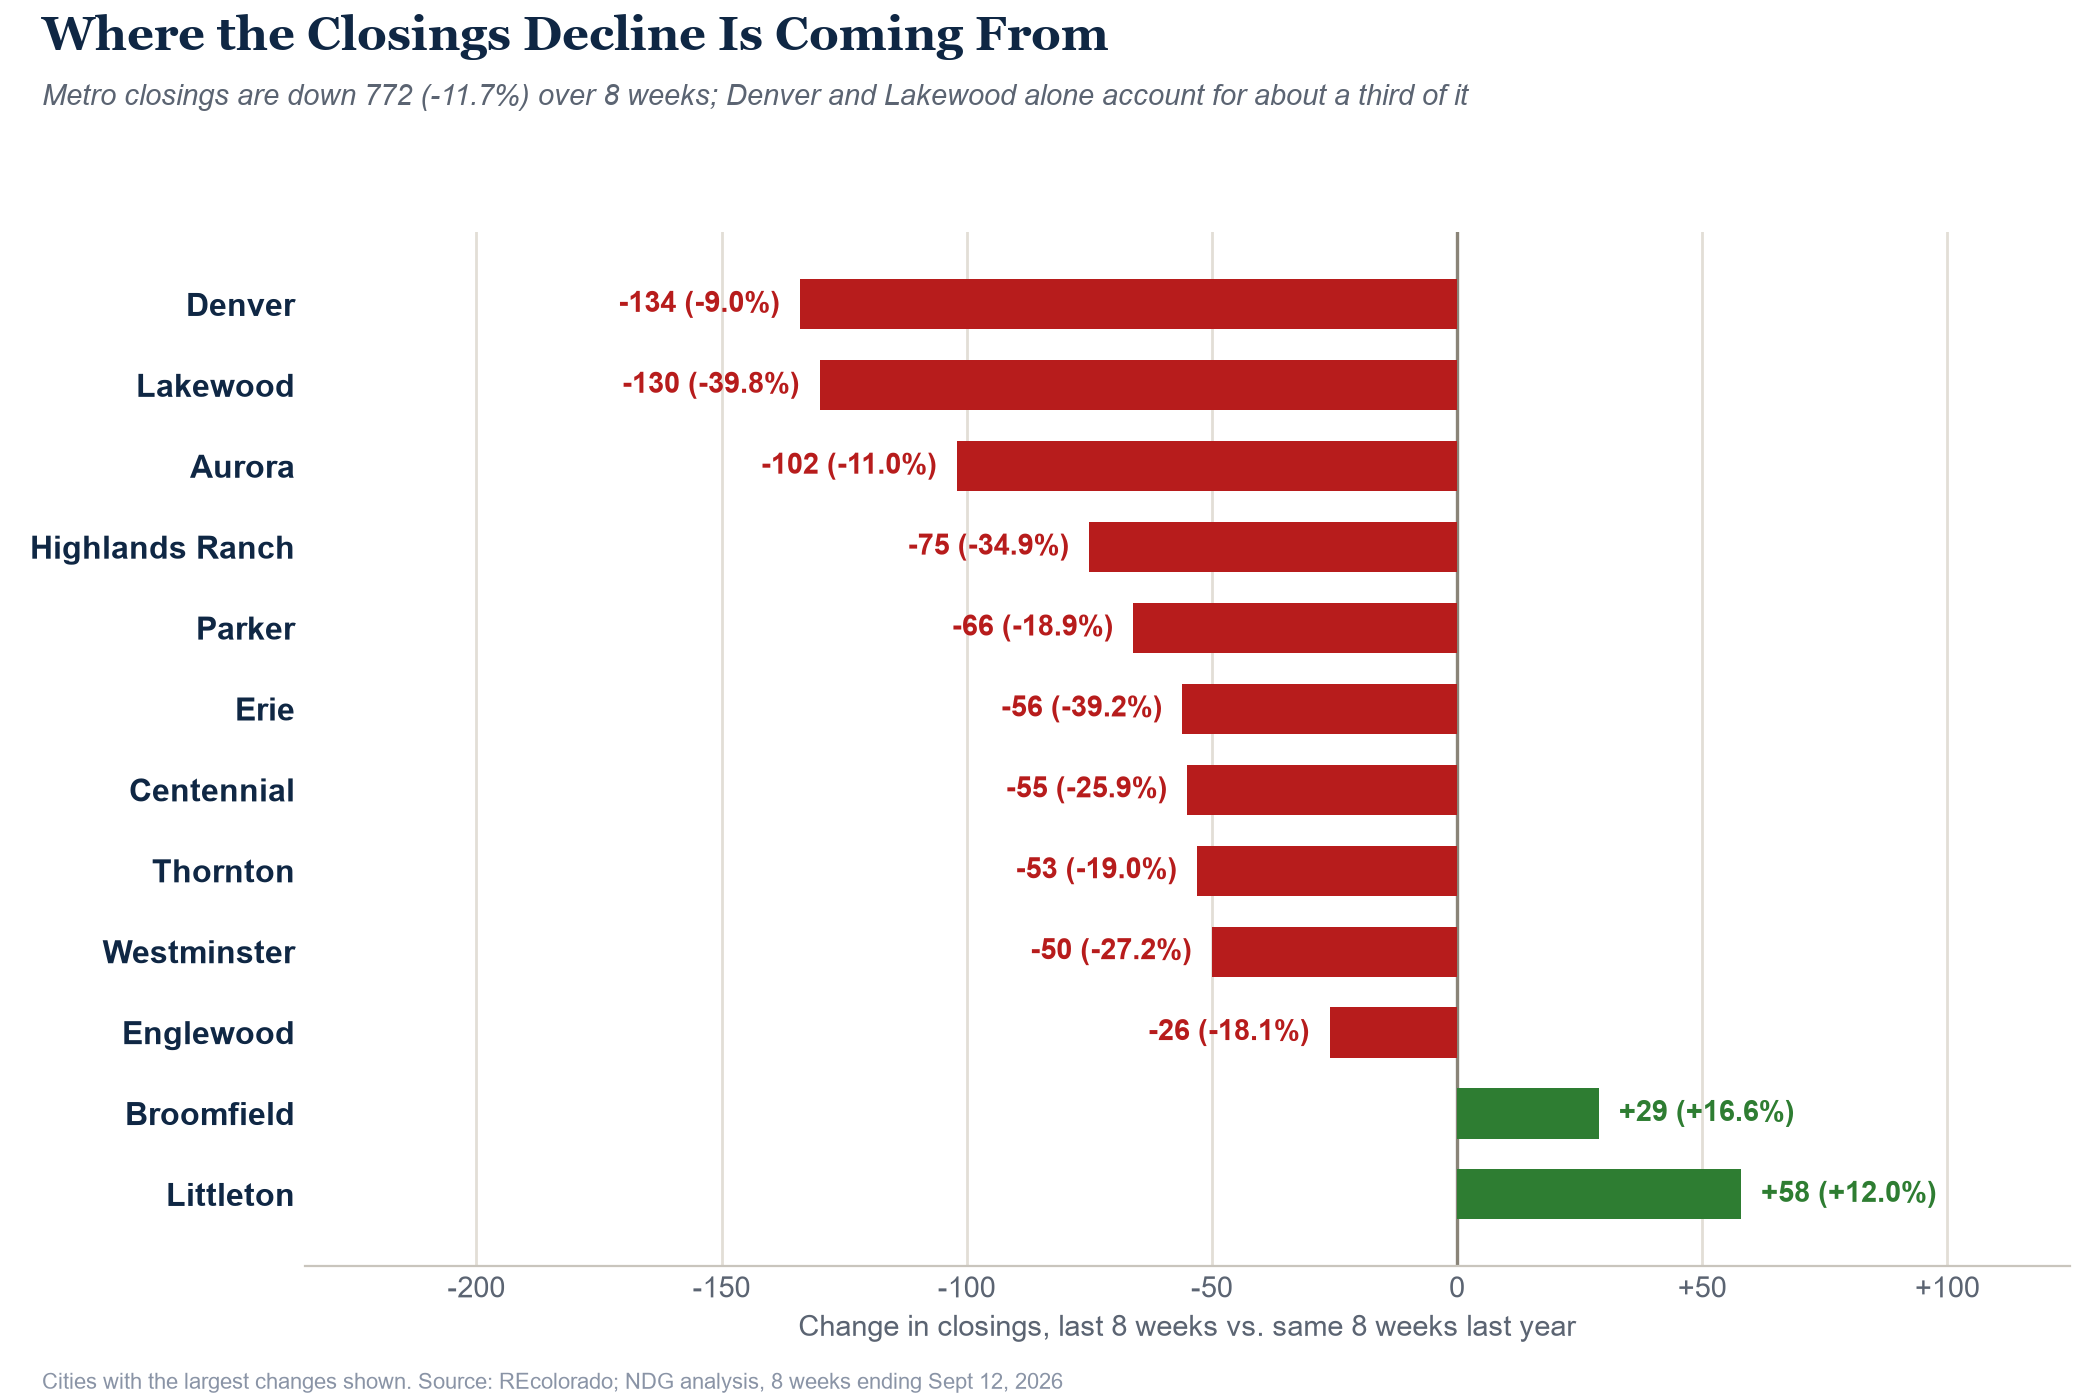
This week’s 539 closings sit in a four-day, Labor Day-shortened week, so single-week comparisons mean little; over longer windows the gap is clear and widening, from -11.7% over eight weeks to -14.6% over four. That is the summer’s softer contract activity arriving at the closing table, since closings trail contracts by roughly 30 to 45 days. The decline is not spread evenly. Across the metro, closings are down 772 over eight weeks, and Denver (-134) and Lakewood (-130) account for about a third of that, with Lakewood down nearly 40% and Highlands Ranch down about 35%. Littleton (+58) and Broomfield (+29) are running the other way. Median days on market for closings edged up to 31 from 28. The contracts written this month, in the higher-rate environment described above, will not close until October and November.
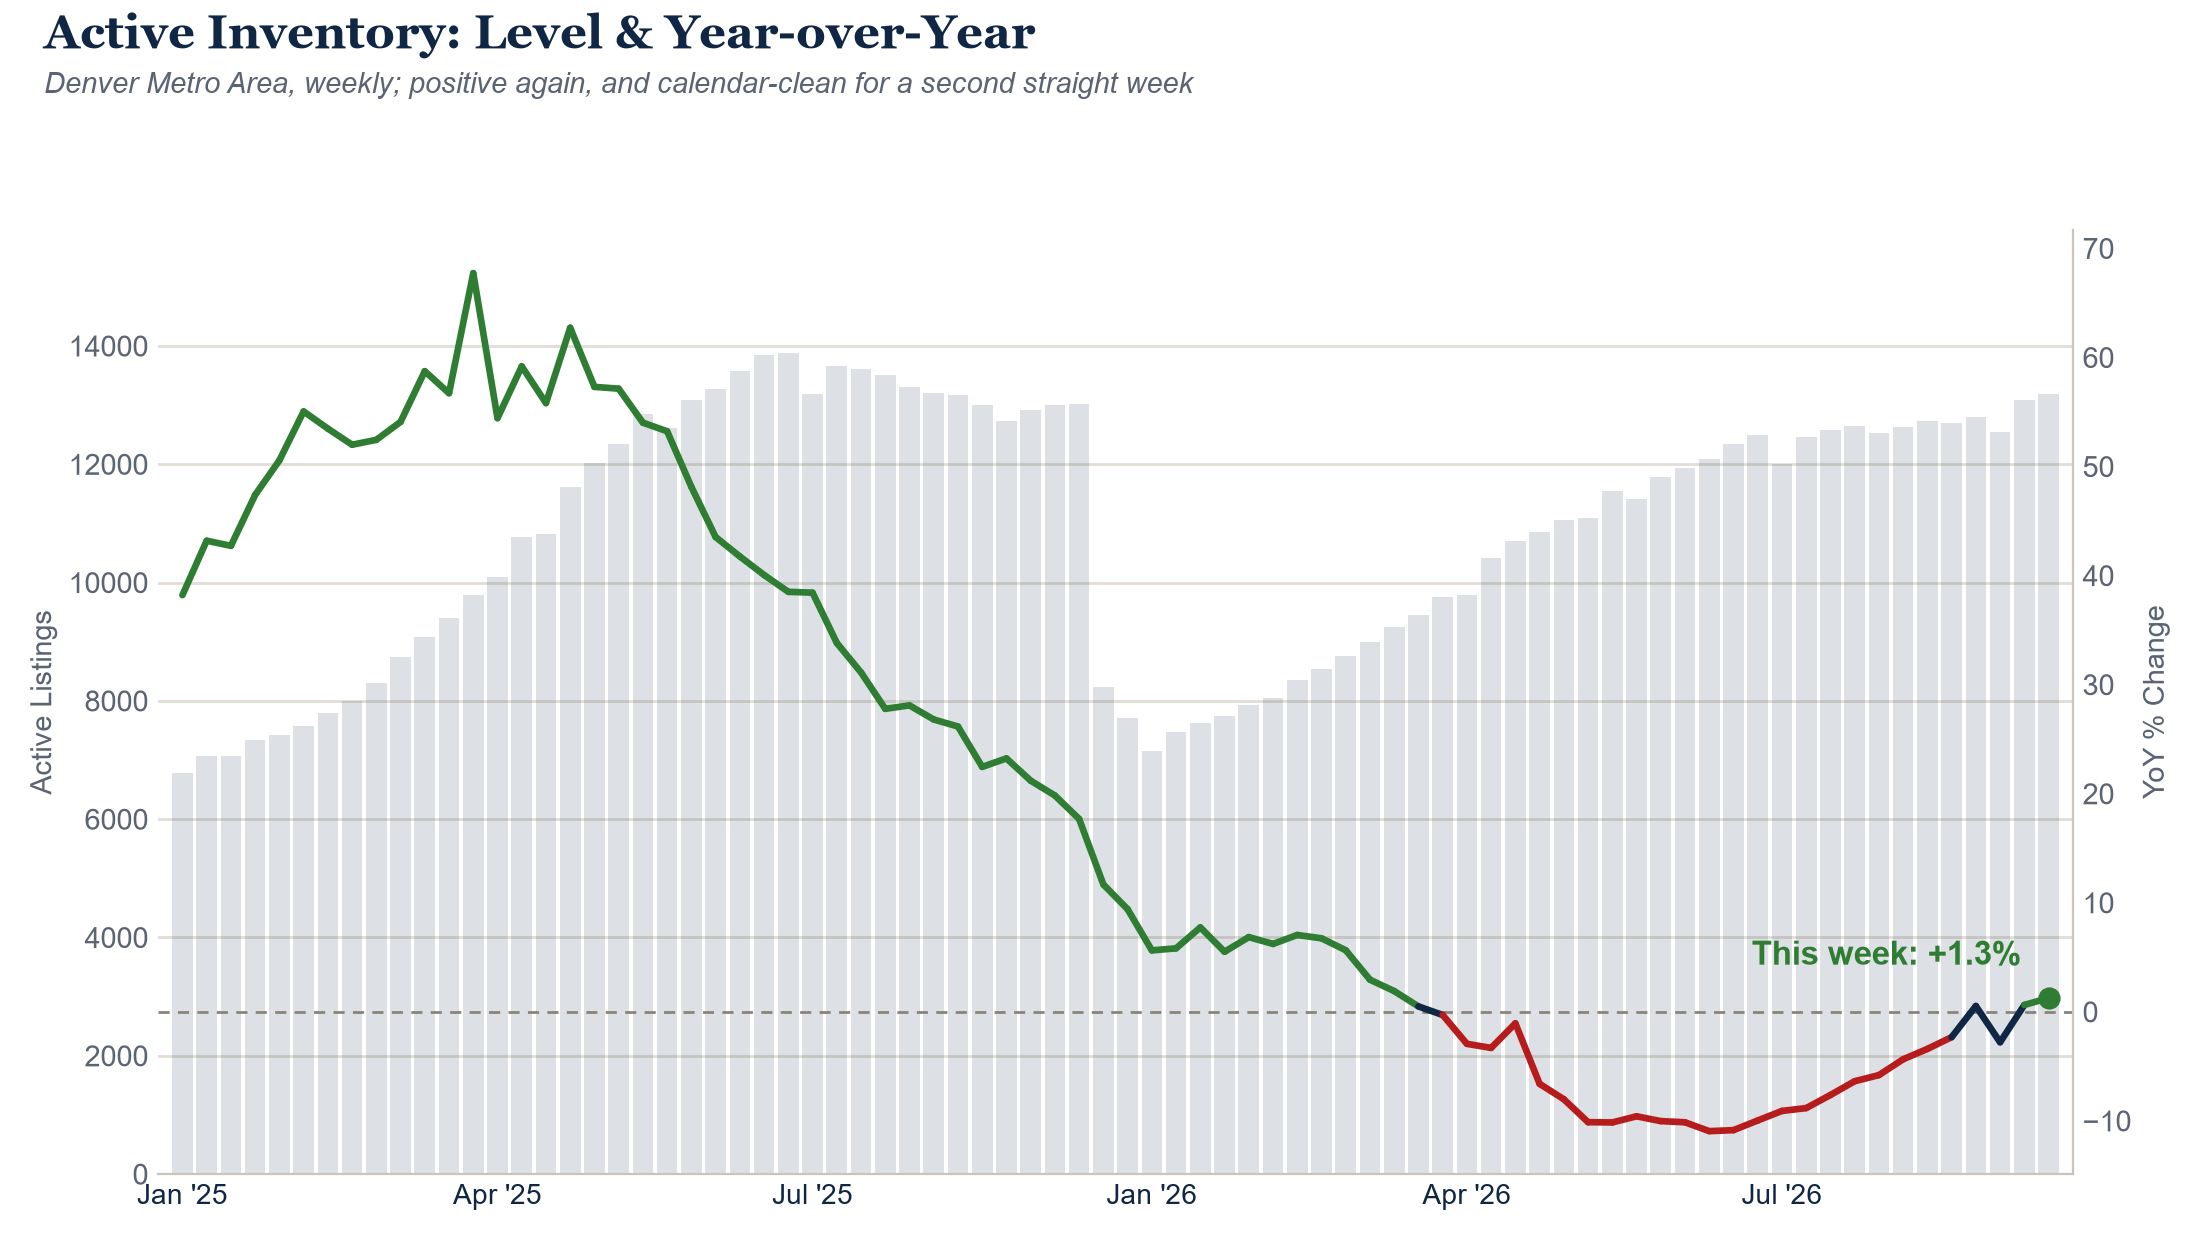
13,179 Active Listings: The Highest in 13 Months
1,466 New Listings: The Post-Labor Day Rush Was Real
This is the data behind last week’s inventory jump. We suggested last week that the surge was not coming from a wave of new listings; with a week of additional data, it clearly was. Compared with the matching holiday week last year, new listings are up 3.8%, and up 9.7% over the last two weeks combined. Sellers also came to market with higher asking prices, a median original list price of about $625,000, up 4.2% from the same week last year. More supply, higher asks, and fewer buyers touring is a mismatch that tends to resolve through price reductions and longer days on market.
57.4% of Active Listings Have Reduced, Still Slightly Behind Last Year
4.72: The Highest Reading of 2026, With a Holiday Asterisk
Months of supply divides inventory by the last four weeks of closings, so the Labor Day week’s 539 closings pulls the average down and pushes the ratio up; part of this jump is the calendar, and that short week stays in the four-week window into early October. Even so, the direction is the one the rest of this update points toward: on the same math, months of supply was roughly 4.0 a year ago, and inventory is building while closings are shrinking. See the Call check below.
The Big Picture: Call Status and New Calls
Everything in this update connects to the first section. Rates hit a 20-month high on a bond market that is still repricing the Fed, showings failed to rebound after Labor Day, pending contracts gave back last week’s improvement, and closings are running 12% to 15% below last year and will feel the effect of this month’s higher rates in October and November. On the other side of the market, supply is at a 13-month high with a rush of new listings, and price reductions, while catching up, are still slightly behind last year’s pace overall (attached homes are the exception, ahead of last year for the first time in about 10 weeks). Buyers have less appetite and more choice; sellers have more competition and less time. For sellers, pricing accurately from the first day matters more than it did a few months ago. For buyers, negotiating leverage is improving even as monthly payments rise. None of this is a collapse, but it is the leading edge of a slower market, and we expect it to last.
One of the more interesting features of this market is what has not happened yet. Showings have been below last year every week since early July, and the gap is now beyond 10%. Pending contracts have run roughly 9% below last year for two months. With that much less demand, you would expect sellers to be cutting prices and letting listings expire in large numbers. Neither is happening: price reductions are still slightly behind last year’s pace overall, and expirations are only modestly above last year (about 4% higher at this month-end, and about 11% higher across ordinary weeks). So far, sellers are holding on rather than giving in. That is pressure that has not yet been released, and we expect both measures to trend higher year over year in the coming weeks, especially now that rates are above 7%. Reductions and expirations are the two numbers we will watch most closely.
Call check, pending deficit: we called for the pending deficit to persist, graded when Showings’ year-over-year gap either improves past -8% for two straight weeks or worsens past -15%. Calendar-aligned, the Showings gap is now -14.8%, just short of the -15% trigger (as reported it is -11.7%), and the trend is toward the call being right. Still open.
Call check, months of supply: Total Closed MSI has not cleared 5.0 or dropped below 4.1 for two straight weeks, so this stays open. At 4.72 it is the closest it has come, though the Labor Day week is inflating it, so we will watch what happens once that week rolls out of the window.
Call check, active inventory: we called for inventory to be positive year-over-year and to hold through the rest of 2026. Both clean readings since Labor Day have been positive (+0.6%, then +1.3%), and the level is the highest in 13 months. Still tracking right, with grading at the final tracked week of the year.
Call check, pending resilience: last week we called the improvement in Pending Contracts short-lived, to be graded over 4 to 6 weeks against the -8% to -9% baseline. The first check-in already lands on the call’s side (-9.9% over two weeks), but we will not grade it on one reading. Still open.
New call: we expect mortgage rates will not return below 6.75% at any point in the rest of 2026. It is the level rates sat near in mid-August, before the current move, and getting back to it would take a decline of roughly 45 basis points from here. We will grade it against our daily rate tracking: call right if no daily rate closes below 6.75% through Dec 31, 2026, wrong if one does.
Second new call: we expect sellers to start giving ground, with both price reductions and expirations moving above last year’s pace. We will grade it through the week ending Oct 31, about six weeks out. Call right if the share of all active listings with a price reduction runs above the year-ago share for two straight weeks, and expirations in the two month-end weeks (ending Oct 3 and Oct 31) each run higher than last year by more than September’s 3.9% gain. Call wrong if either condition is not met by then.