

Mortgage rates eased for a second straight week, but buyers have not responded. Showings are 22% below last year, the widest gap since May 2023, and new contracts are running 21% behind, a shortfall that now stretches back 23 weeks to mid-May. Closings are starting to show it too. Sellers, meanwhile, are still not blinking: price reductions are tracking last year, and expirations are only modestly higher. This week we also add a closer look at recent closings and a new measure, immediate sales, and we look at a Fannie Mae forecast that could change the rate outlook. That continues the thread from last week’s update.
10,423 Showings: 15 Straight Weeks Behind Last Year, and the Gap Is Widening
Showings fell 4.5% to 10,423, the fourth straight weekly decline and the seventh in the last eight, and are running 22.1% behind last year. That is the widest gap since the week ending May 19, 2023 (-25.9%), and the 15th consecutive week below last year. Across that stretch, there have been 24,188 fewer showings than in the same weeks last year, an 11.1% shortfall. The recent weeks are far worse than the stretch as a whole: each of the last six weeks has been 10% or more below last year, the last six weeks together are down 15.5% (12,645 fewer showings), and the gap has widened three weeks in a row, from -10.5% to -12.7% to -19.4% to -22.1%. Labor Day timing does not explain it: lined up by position around the holiday, the last four weeks are down 17.2%.
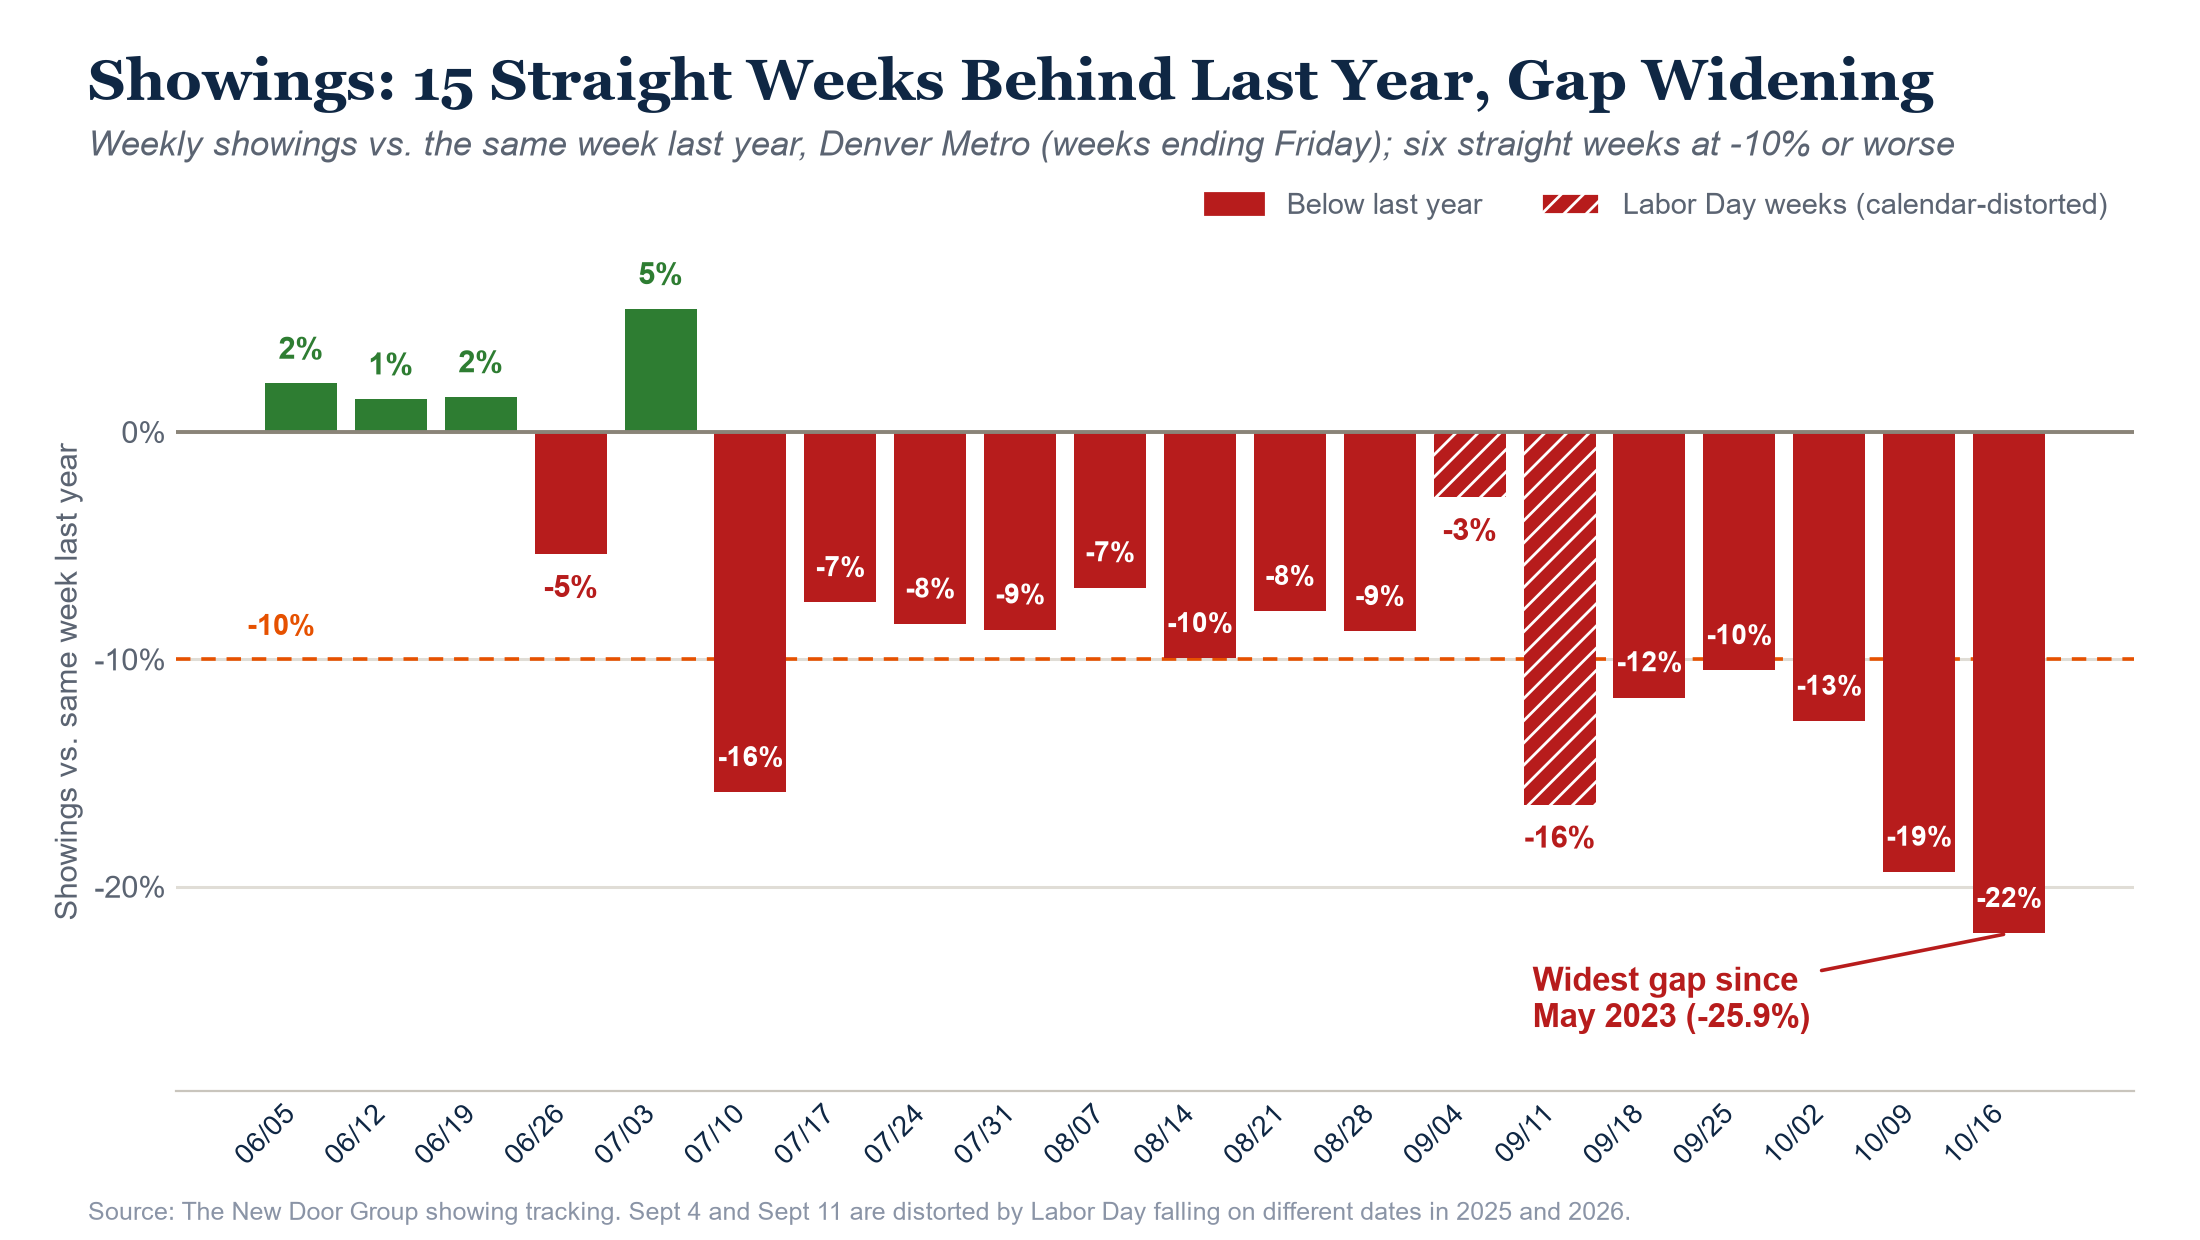
Showings per listing, the number of tours the average home gets each week, fell to 0.81 for the week ending Oct 16, the eighth straight weekly decline and the sixth straight week below 1.0. At 0.81, the typical listing is drawing about four showings every five weeks. Our city-by-city tracking runs one week behind that reading and has the metro at 0.83 for the week ending Oct 10. It shows 21 of the 35 cities with active listings below 1.0, and seven more sitting between 1.00 and 1.05, including Arvada, Littleton, Lakewood and Golden, so the list of cities under 1.0 is likely to keep growing.
596 New Contracts: Down 21%, and the Shortfall Now Spans 23 Weeks
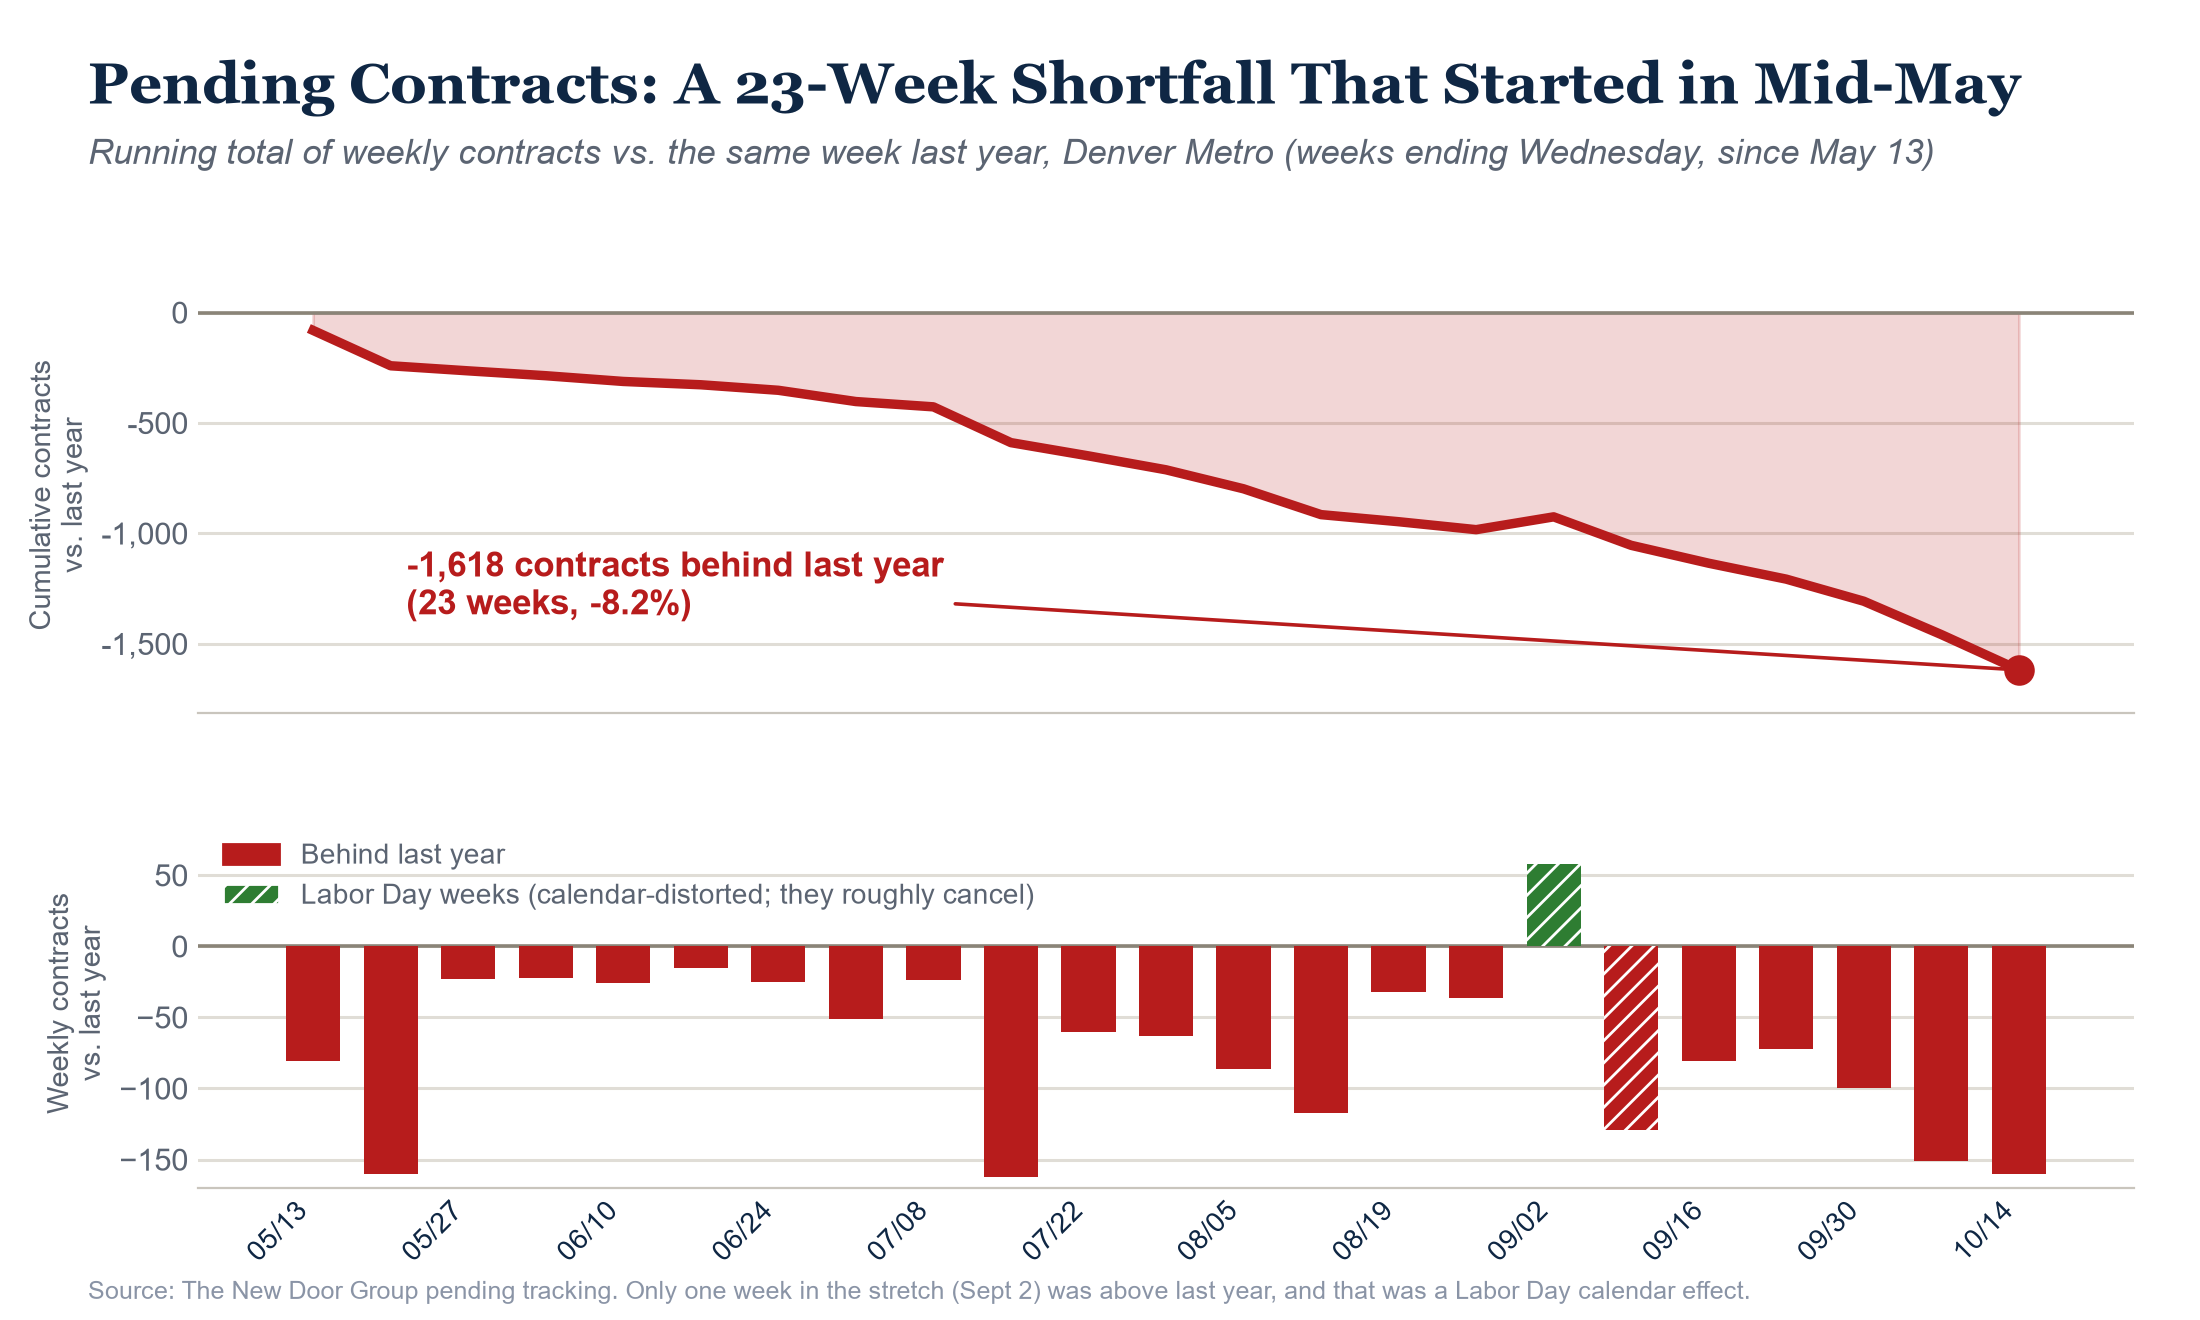
Contracts fell for the fourth straight week to 596 and are 21.2% behind last year, the largest deficit since the week of Dec 10, 2025 (-26.2%). Attached homes are down 35.9% (116 contracts) and single-family homes down 16.7% (479). The six straight weeks below last year understate how long this has gone on, because the Labor Day week of Sept 2 (+7.8%) was only a calendar effect. Contracts have trailed last year in 22 of the last 23 weeks, going back to the week ending May 13, and the total shortfall over that stretch is 1,618 contracts, or 8.2%. The last four weeks alone are 15.6% behind (2,616 vs. 3,099), roughly double the pace of the stretch as a whole.
Immediate Sales: Single-Family Is Holding Up, Condos and Townhomes Are Not
A new measure we are adding: immediate sales, the share of contracts signed within seven days of a home being listed. Over the last four weeks, 21.7% of all contracts were immediate sales, up from 19.5% a year ago, and for single-family homes the share is 24.4% versus 20.7%. In other words, there are fewer contracts overall, but the single-family homes that do draw an offer are still going under contract quickly. Condos and townhomes tell the opposite story: 11.6% and 12.7% of their contracts were immediate, below last year’s 13.7% and 16.4%. For perspective, the share has fallen steadily for years, from 54% of all contracts in 2022 to 38% in 2023, 32% in 2024 and 25% in 2025, and it is 29% so far in 2026, a seasonal mix that is strongest in spring. The single-family edge over last year was about 3 to 5 points all summer; September was flat, and October is back ahead.
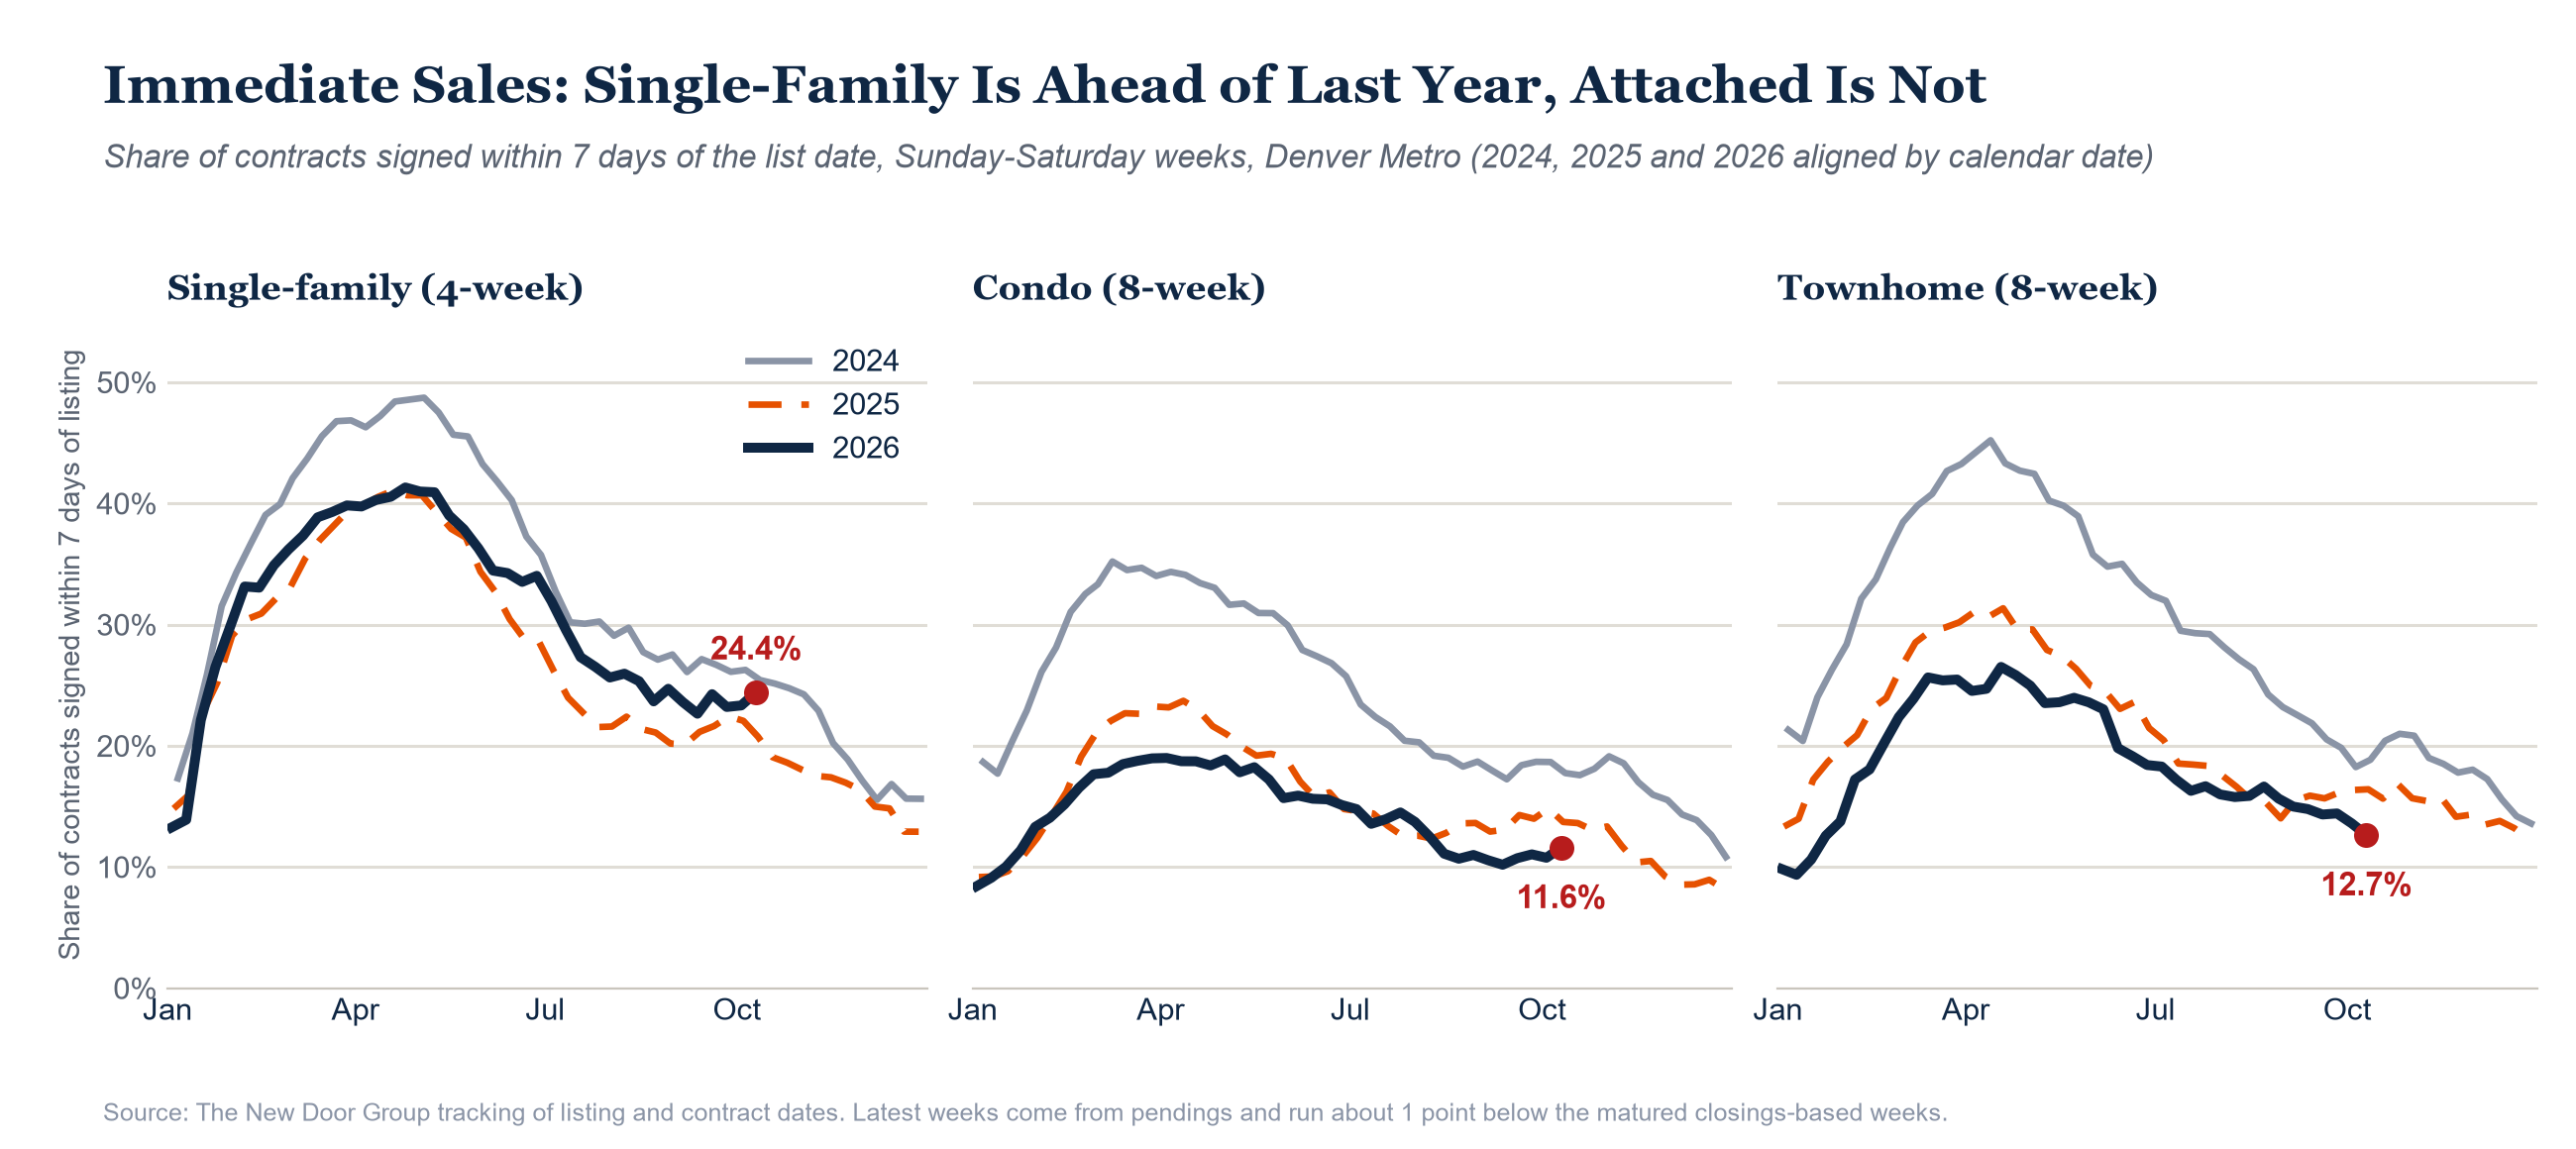
Immediate sales are measured by contract date for Sunday-to-Saturday weeks. Weeks more than eight weeks old come from closed sales; the latest weeks come from all contracts, including any that later fall out, and run about 1 point lower, so the improvement is, if anything, slightly understated. Condo and townhome weeks hold only about 85 contracts, so we use eight-week averages for them.
7.37%: Rates Eased Again, but Fannie Mae Now Forecasts 7.5% Through 2027
Rates improved again this week. The Friday close of 7.37% was 11 basis points lower than the 7.48% a week earlier, the second weekly decline in a row, and the week averaged 7.40% against 7.55% the week before. Freddie Mac’s weekly survey held at 7.40% on Thursday. It is better, but still not low: rates are 1.14 points above last year, and the 4-week average of 7.46% remains the highest since November 2023.
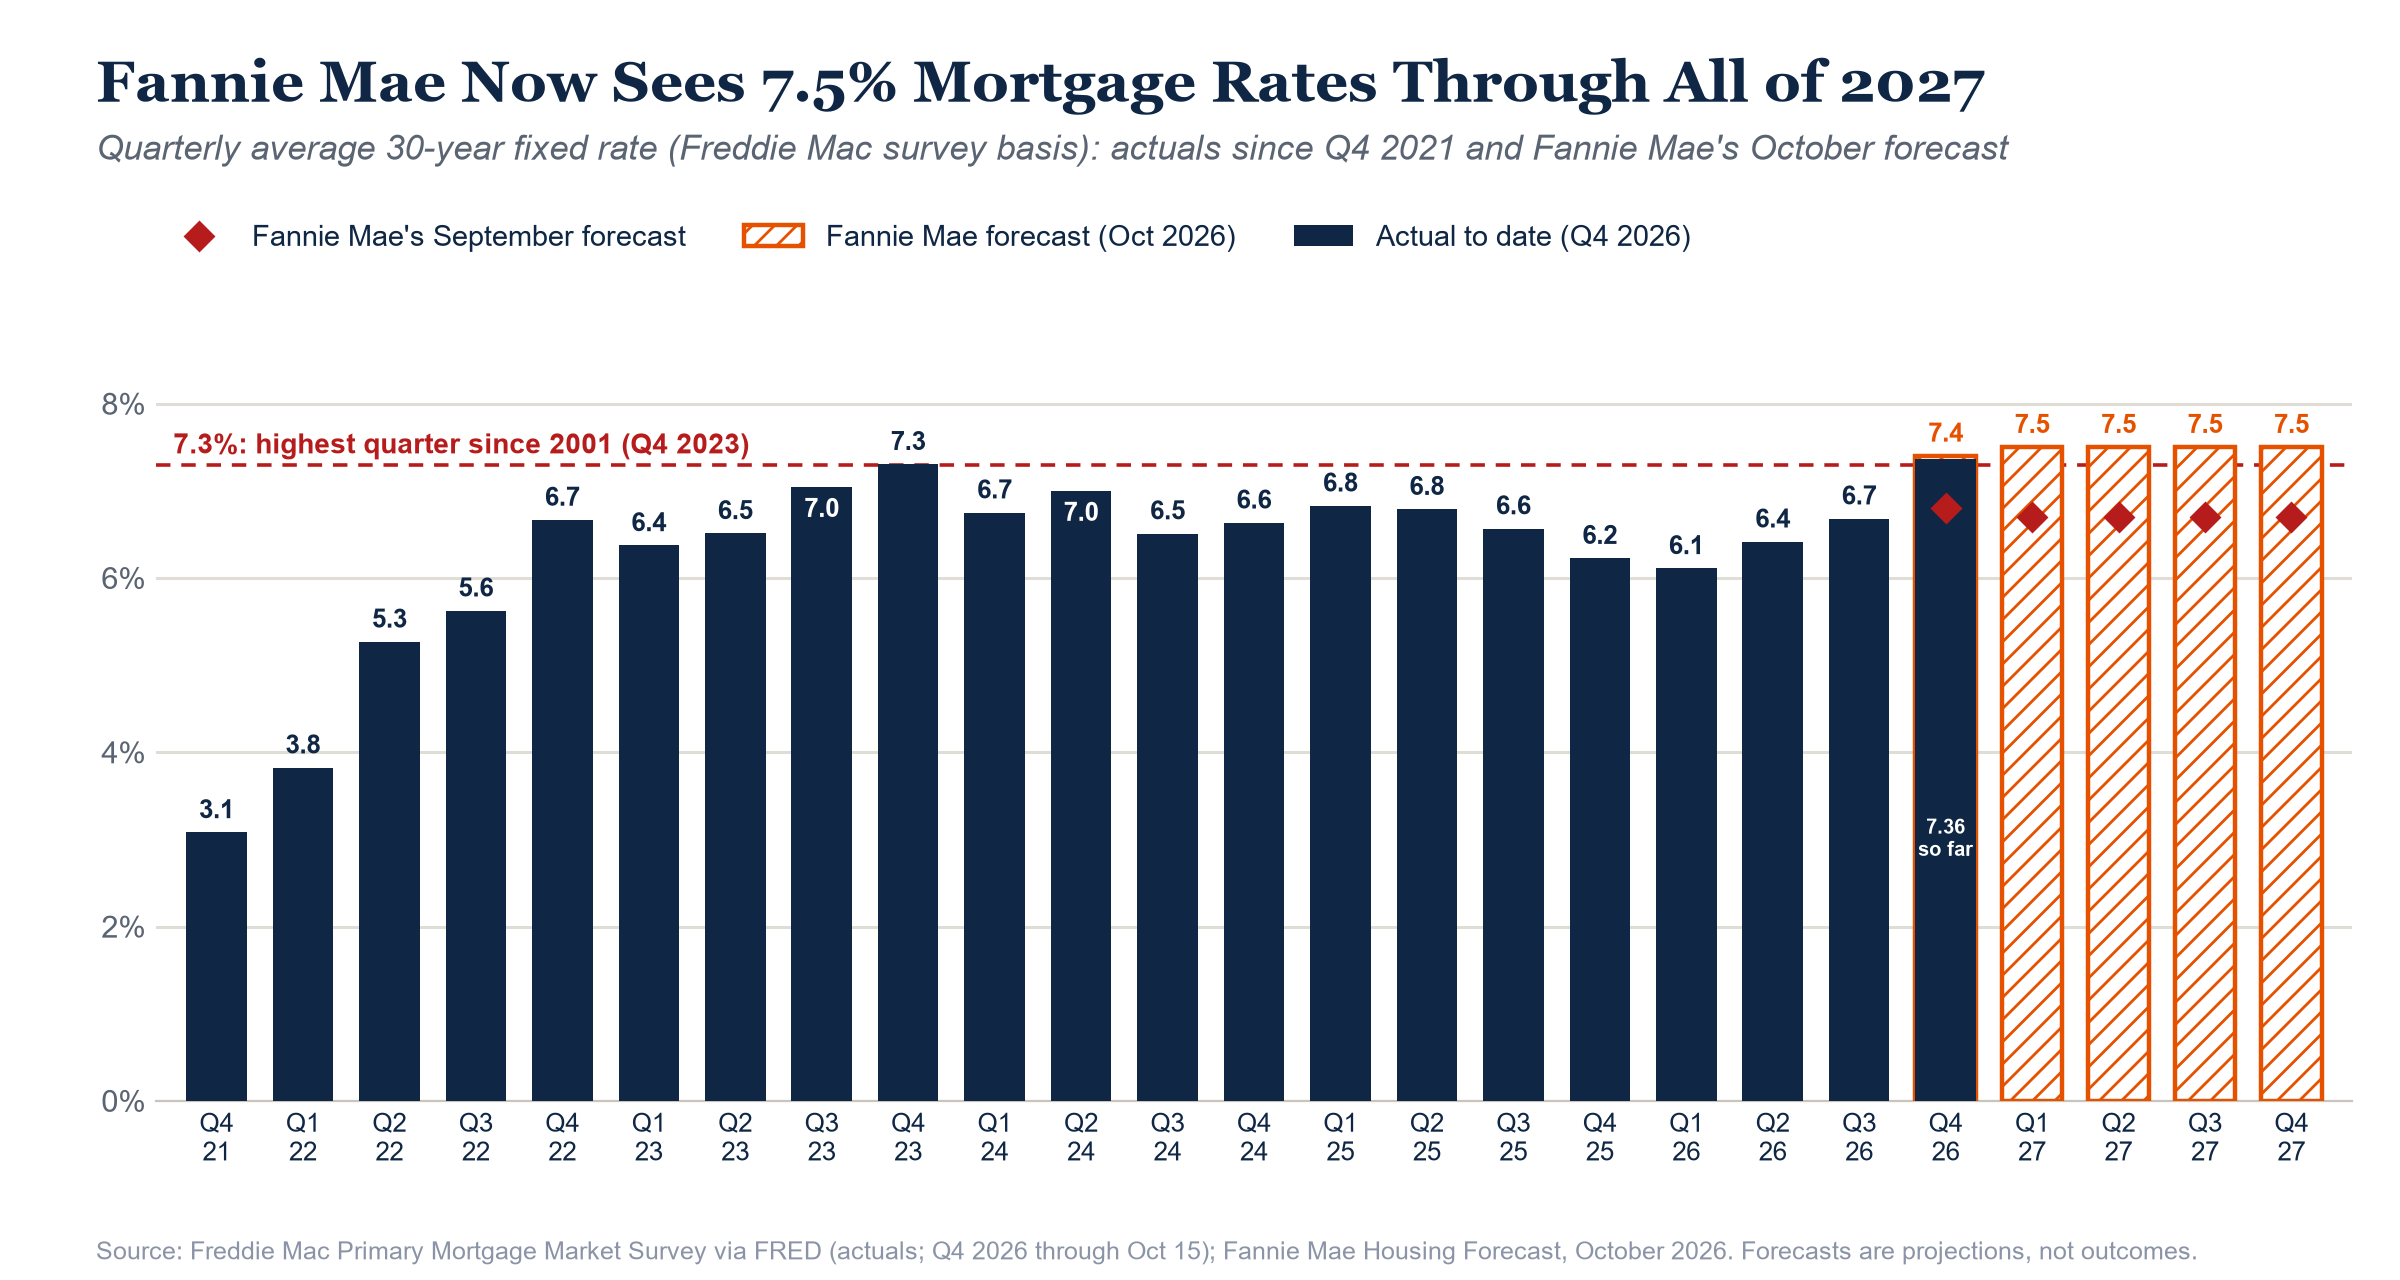
The bigger news may be a forecast. On Oct 14, Fannie Mae sharply raised its mortgage rate outlook: it now expects the 30-year fixed rate to average 7.4% in the fourth quarter of 2026 and 7.5% in every quarter of 2027, up from 6.8% and 6.7% in its September forecast. A full year averaging 7.5% would be the highest sustained level since 2000 on Freddie Mac’s survey: no quarter since 2001 has averaged above 7.3% (the fourth quarter of 2023), and the last quarter at 7.5% or higher was the fourth quarter of 2000. Our own daily rate tracking, which we keep back to the fourth quarter of 2021, tells the same story: no completed quarter has averaged 7.5%, the highest was 7.36% in the fourth quarter of 2023, and only three quarters have averaged more than 7.1%. Fannie Mae pointed to stubborn inflation, which accelerated to 3.7% in September, and rising Treasury yields.
New Listings Down 6.1%, and Inventory Is Barely Moving From Its High
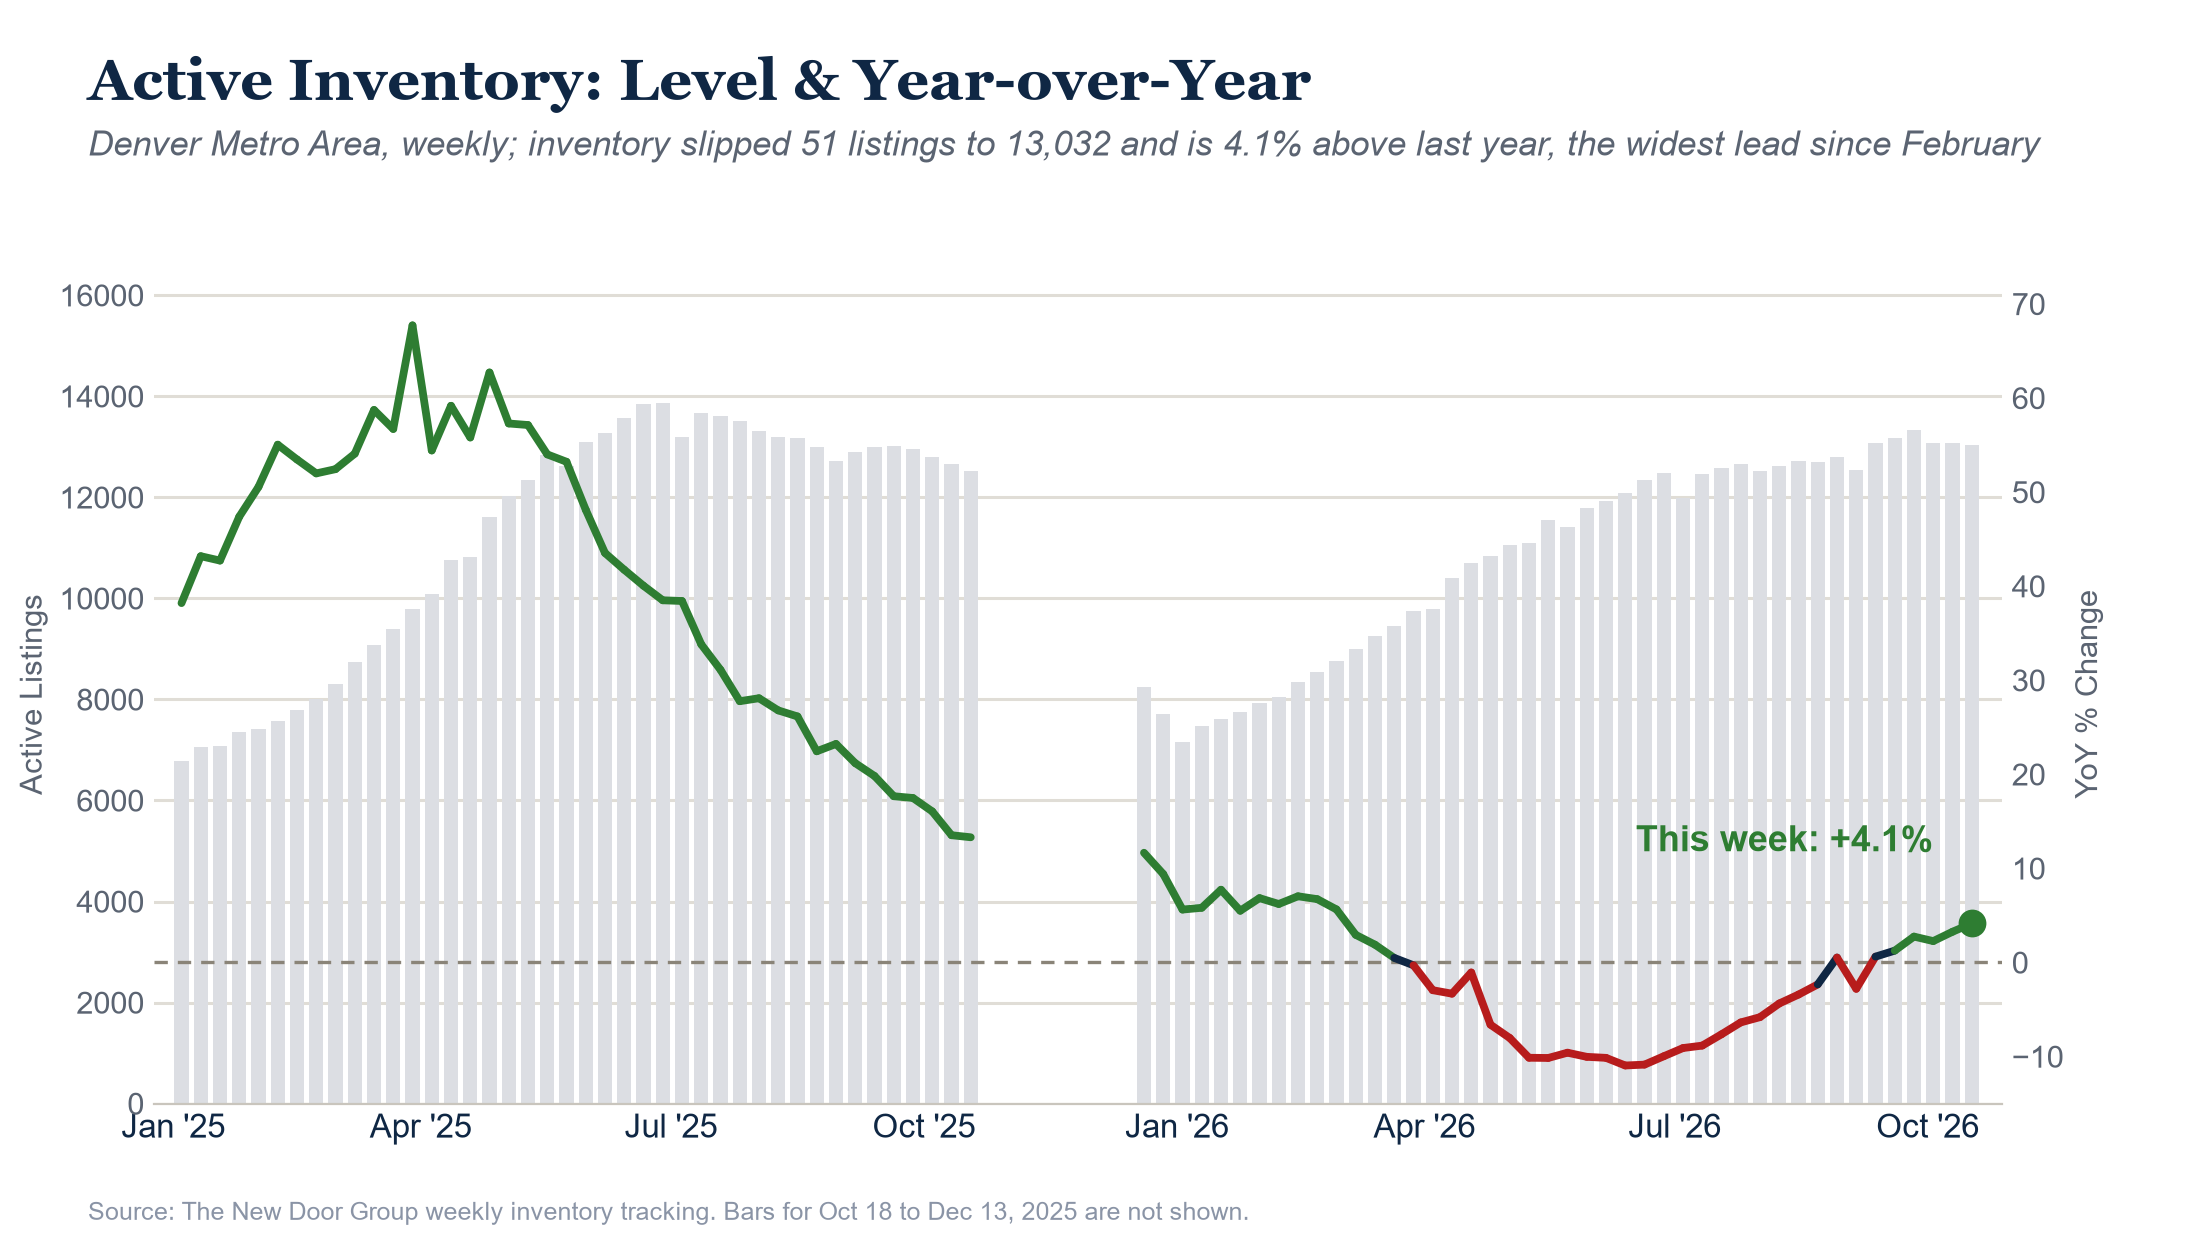
New listings totaled 980, down 6.1% from last year. That is the smallest deficit in four weeks, after three straight weeks near 10% (-9.6%, -10.0% and -9.5%), but it is still a fourth straight week of fewer listings than a year ago, with single-family listings down 5.0% and attached down 9.3%. Active inventory peaked at 13,324 three weeks ago and has barely backed off: it slipped 51 this week to 13,032, only 292 below that high. Because last year’s inventory was still falling at this point in the season, the gap to last year keeps growing, and +4.1% is the widest lead since the end of February (+5.6%).
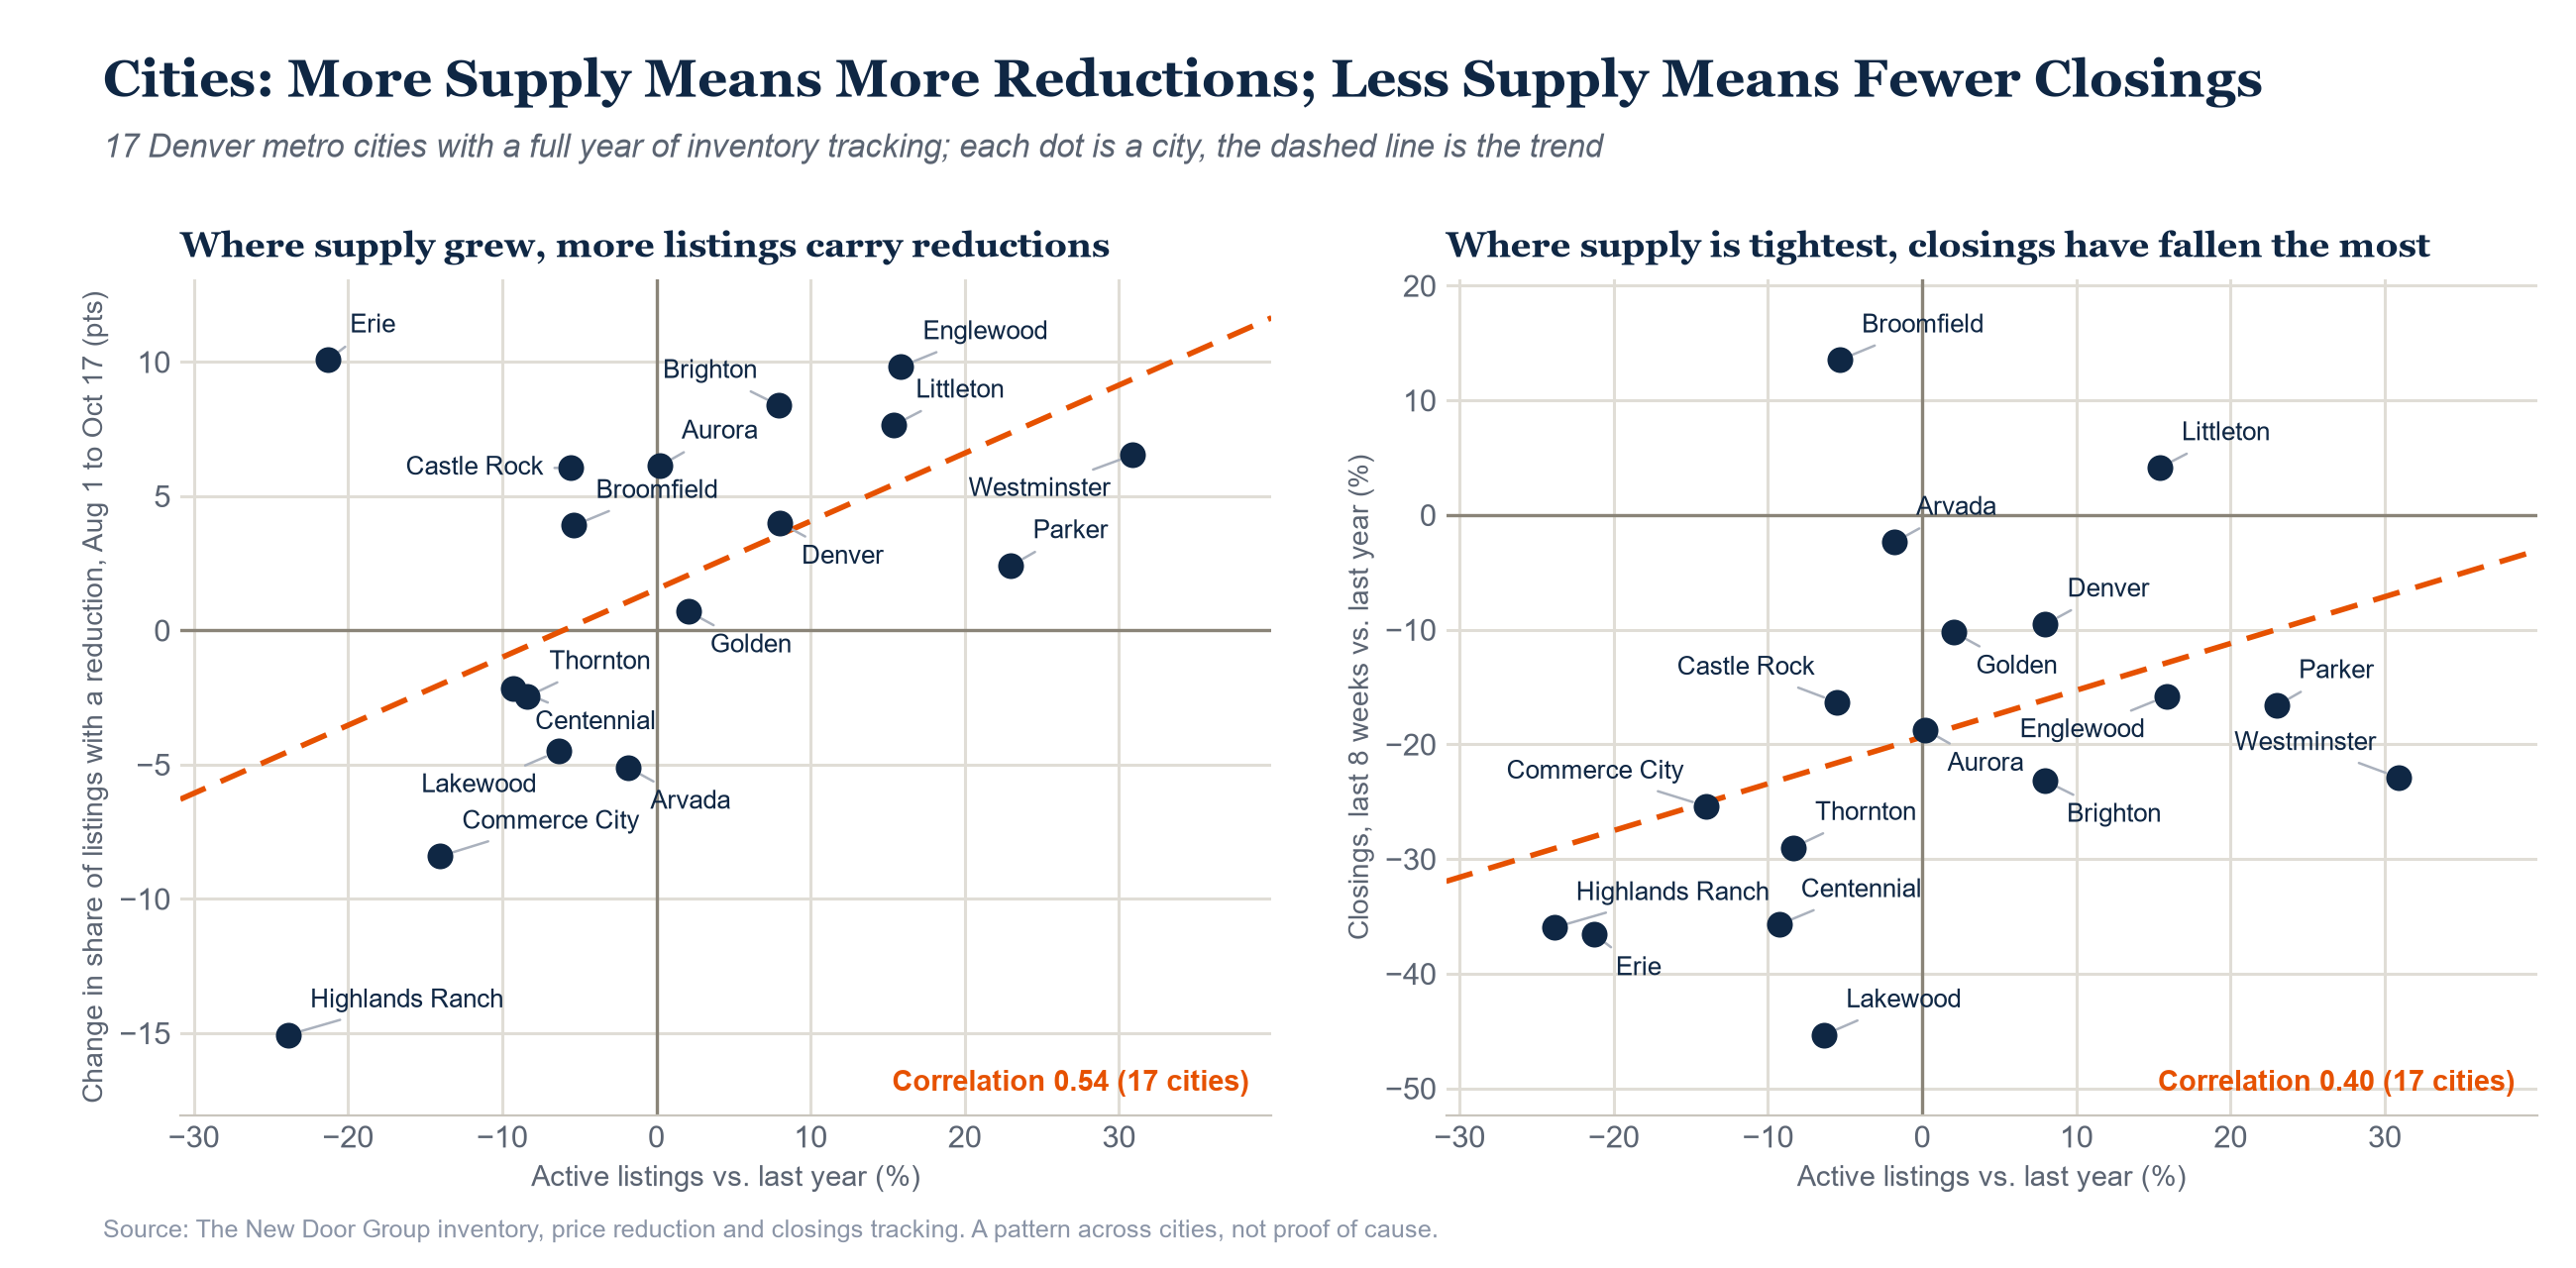
The lead is not shared evenly, and the pattern is worth watching. Eight of the 17 cities with a full year of tracking now have more homes for sale than last year, led by Westminster (+30.9%), Parker (+23.0%), Englewood (+15.9%), Littleton (+15.4%), Denver (+8.0%) and Brighton (+8.0%), while Highlands Ranch (-23.9%), Erie (-21.3%), Commerce City (-14.0%) and Centennial (-9.3%) have far fewer. Since early August, the share of listings with a price reduction has risen an average of 6.5 points in the six cities with the biggest supply gains and fallen 3.8 points in the six where supply is tightest. Closings tell the mirror-image story: over the last eight weeks they are down about 14% in the six highest-supply cities and about 35% in the six tightest, where there are fewer homes available to buy.
Closings: Fewer Sales, Steady Prices, and a Gap That Opened in August
Closings lag contracts by 30 to 45 days, so the contract shortfall that began in mid-May is now reaching the closing table. For most of the year closings tracked within a few points of 2025 (March +3%, April +1%, June flat), but August was down 13% and September down 17%. The last eight weeks are 16.1% behind last year, and last week’s 583 closings were 18.0% below the 711 of the same week a year ago. Prices and terms have held up better than volume. Here is how the year looks so far, January through September against the same months of 2025:
| Property type | Closings | Median closed price | Median days on market | Net closing ratio | Sales with concessions |
|---|---|---|---|---|---|
| Single-family | -3.4% | $650,000 (flat) | 17 (vs. 19) | 97.2% (+0.1 pt) | 63.9% (+1.0 pt) |
| Condo | -11.1% | $320,000 (-3.6%) | 42 (vs. 38) | 95.0% (-0.4 pt) | 57.7% (+0.3 pt) |
| Townhome | -8.7% | $446,000 (-2.2%) | 32 (vs. 27) | 96.0% (-0.7 pt) | 66.4% (+1.5 pts) |
| All property types | -4.9% | $595,000 (flat) | 20 (vs. 22) | 96.9% (flat) | 63.5% (+1.0 pt) |
Closings from Jan 1 to Sept 30, 2026 versus the same period of 2025. Net closing ratio is the final sales price after seller concessions as a share of the original list price (median). Days on market is the median number of days in the MLS before the home went under contract.
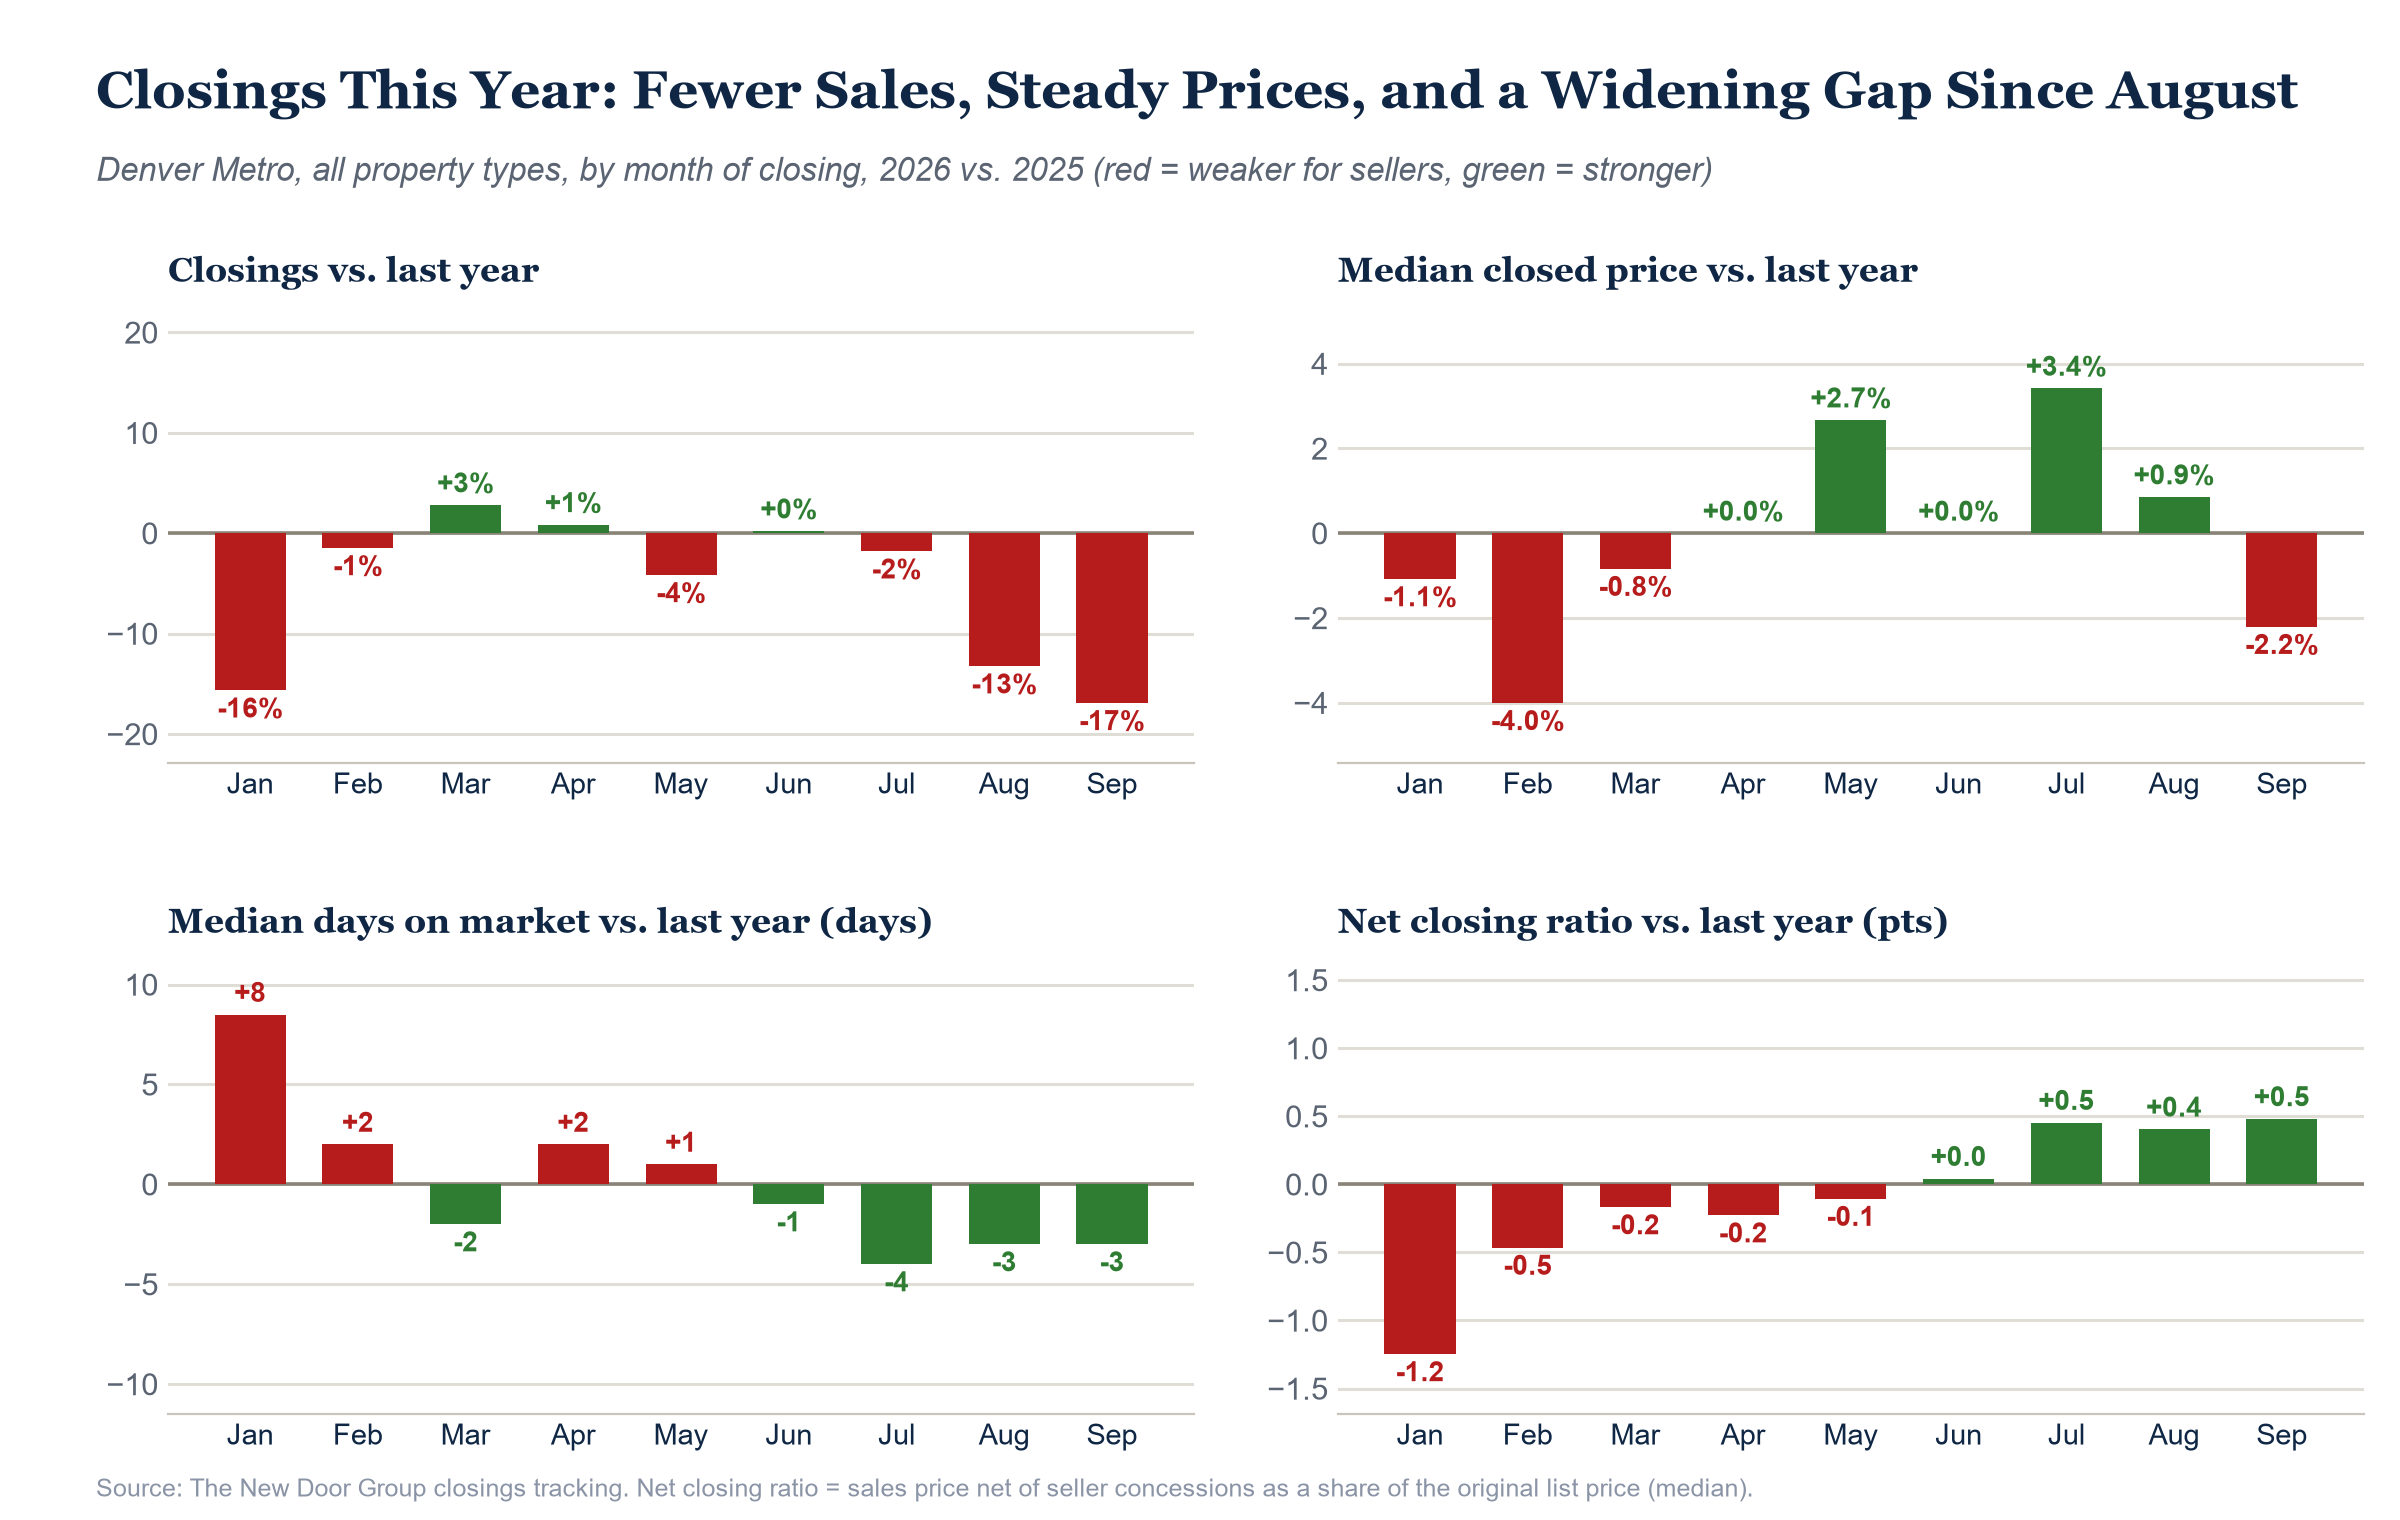
The split between property types is the story. Single-family sellers who are closing are getting the same prices, closing faster and netting slightly more of their original list price. Over the last eight weeks, the single-family net closing ratio is 96.0%, up from 95.4%, and the median days on market is 26.5, down from 30. They are simply closing fewer homes. Attached homes are where every measure is weaker: over the same eight weeks, typical condo prices are about 6% below last year, townhome prices about 5% lower, net closing ratios are down 1.2 points for condos and 0.6 point for townhomes, and homes are taking about five days longer to reach a contract. Those figures are weighted from weekly medians, so treat them as typical readings.
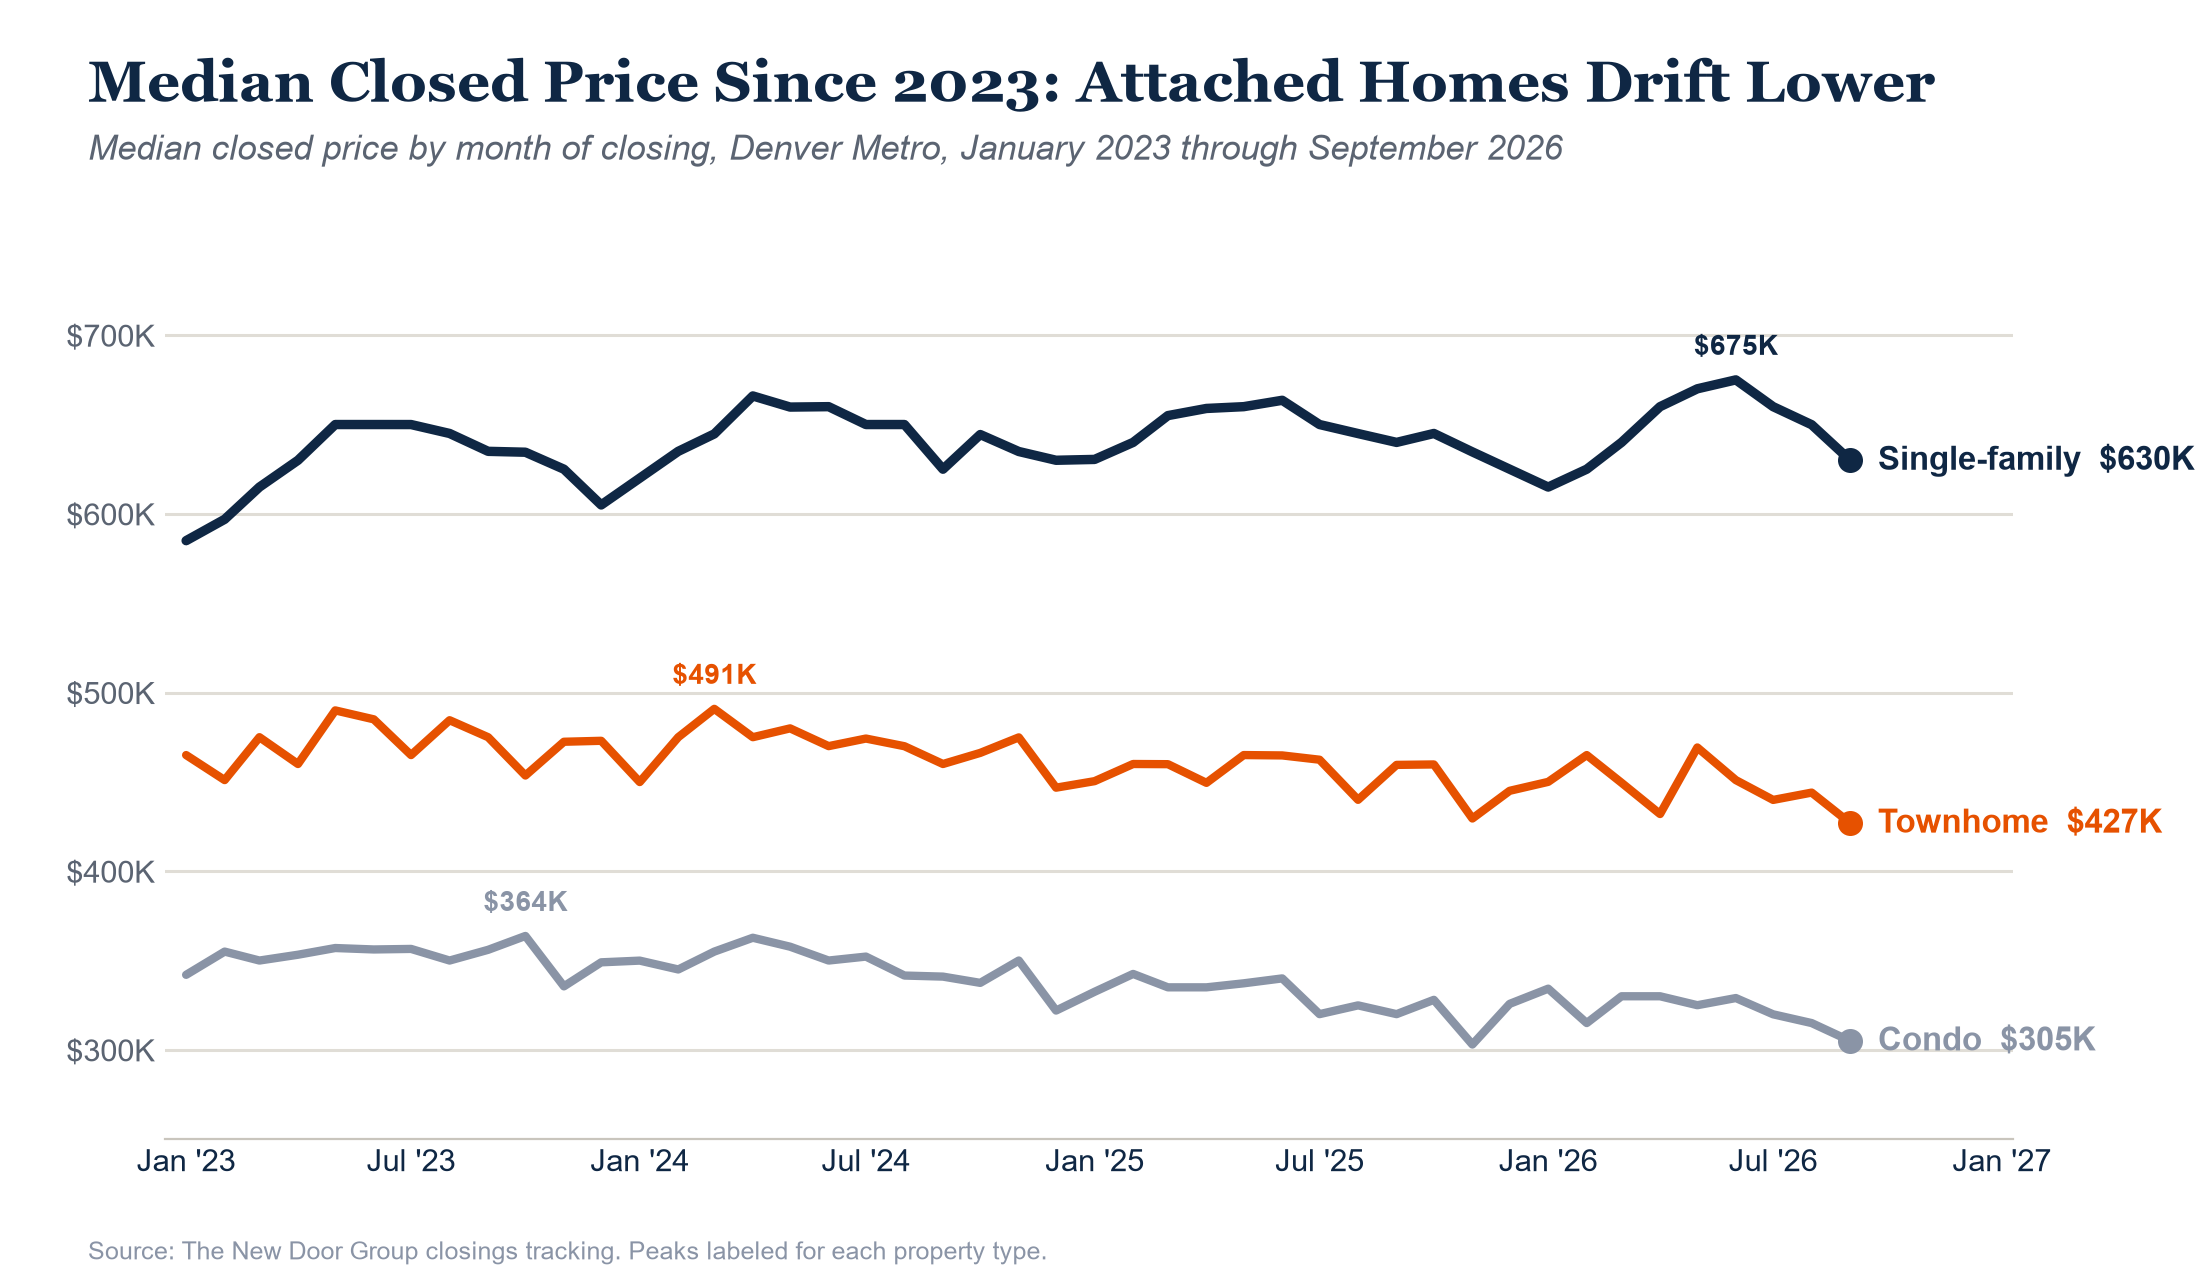
The longer view makes the same point. The single-family median has stayed in a band of $585,000 to $675,000 since 2023, and $630,000 in September compares with $640,000 a year earlier and a $675,000 peak in June. The townhome median fell to $426,900 in September, the lowest monthly figure in the period, and the condo median of $305,000 is within $2,000 of its low and about $59,000 below its October 2023 high of $363,750.
Pending MSI Is Catching Up With Closed MSI
Closed months of supply slipped again, to 4.77 from 4.85, while pending MSI, which looks ahead, rose to 4.65 from 4.60. Three weeks ago closed MSI (5.07) stood half a month above pending MSI (4.56); the gap is now just 0.12. Closed MSI reflects closings that were signed 30 to 45 days ago, so the narrowing suggests that it is the lagging measure that will move higher as recent contract weakness reaches the closing table. Townhomes have already crossed: their pending MSI of 5.80 is above the closed figure of 5.52, and condos are level at 9.37.
Sellers Still Aren’t Blinking: Reductions Trail Last Year
Price reductions still show no sign of broad seller stress. The share of listings with a reduction was flat at 59.1%, 0.7 point below last year, the widest gap in five weeks, and the single-family and attached gaps are both about 0.6 to 0.7 point. The size of the cuts is growing only incrementally: the average reduction is 6.4% of list price, the same as a year ago, and it has risen from 6.15% to 6.38% since Sept 12, compared with an increase of about 0.1 point over the same stretch last year. Single-family cuts are growing in step with last year (up 0.2 point both years). Attached cuts are higher than last year at 6.85% versus 6.0%, and they have grown faster over the last five weeks (up 0.4 point, versus no change a year ago), even though fewer attached listings are being cut. Listings are sitting a little longer, with the median at 85 days on market this week against 81 a month ago.
Expirations came in at 371 in an ordinary week with no month-end, 14.9% above last year, and the four- and eight-week totals have run 8% to 10% ahead of 2025. That is a steady, modest premium, not a surge. With reductions matching last year’s pace, there is still no sign of seller capitulation; the next real test is the month-end week that closes October.
The Big Picture: Demand Keeps Dropping, and Sellers Still Haven’t Moved
Buyer demand is deteriorating on every front. Showings are 22% behind last year and the shortfall is widening, contracts have trailed last year in 22 of the last 23 weeks, and closings, which lag by 30 to 45 days, are now 16% behind over the last eight weeks. The new immediate-sales measure adds a useful nuance: single-family homes that draw an offer are still selling quickly, and the stall is in everything else, especially condos and townhomes, where prices, days on market and net closing ratios are all softer.
Sellers have not yet reacted. Reductions are tracking last year, expirations are only modestly higher, and single-family sellers who close are holding their prices. Inventory is 4.1% above last year because new listings are only slightly lower than a year ago while demand has fallen far faster. Something has to give: either sellers begin to cut price and let listings expire in larger numbers, or rates ease enough to bring buyers back. Fannie Mae’s new outlook, with rates averaging 7.5% through 2027, raises the odds that sellers will have to adjust first. The city data points to where: cities where supply is growing already show more reductions, and attached homes are showing the first signs of price pressure.
Call check, active inventory: inventory is +4.1% year over year, so the call for it to stay positive through year-end remains on track.
Call check, mortgage rates: we called for rates not to close below 6.75% through Dec 31. At 7.37%, they are 62 basis points above that floor. On track.
Call check, sellers giving ground: expirations are above last year (+14.9% this week, +9.6% over four weeks), but reductions are still below last year (59.1% vs. 59.8%). The Oct 31 month-end week decides it. Still open.
Call check, closings: the 8-week total ending Oct 10 is 5,512, down 16.1% from last year (6,572). We called for at least a 10% deficit through the 8 weeks ending Nov 21. On track.
Call check, showings: we called for showings to average fewer than 8,000 a week for the four weeks ending Nov 27, Dec 4, Dec 11 and Dec 18. This week’s 10,423 would need to fall about 23% to get there, close to the 27% seasonal decline of 2023. Still open.