

Mortgage rates finally eased this week, but buyers have not responded yet. Showings fell to 10,918, the widest gap to last year since May 2023, and new contracts are running 19% behind last year, the deepest deficit since last December. Sellers, meanwhile, are not blinking: price reductions are tracking last year, inventory is holding near its 2026 high, and expirations, while higher than a year ago, are not surging. How long that standoff lasts is the question this week, and we look at what the 2023 slump suggests about the weeks ahead. That continues the thread from last week’s update.
7.48%: The First Weekly Decline in Eight Weeks, and a Reminder We Have Been Here Before
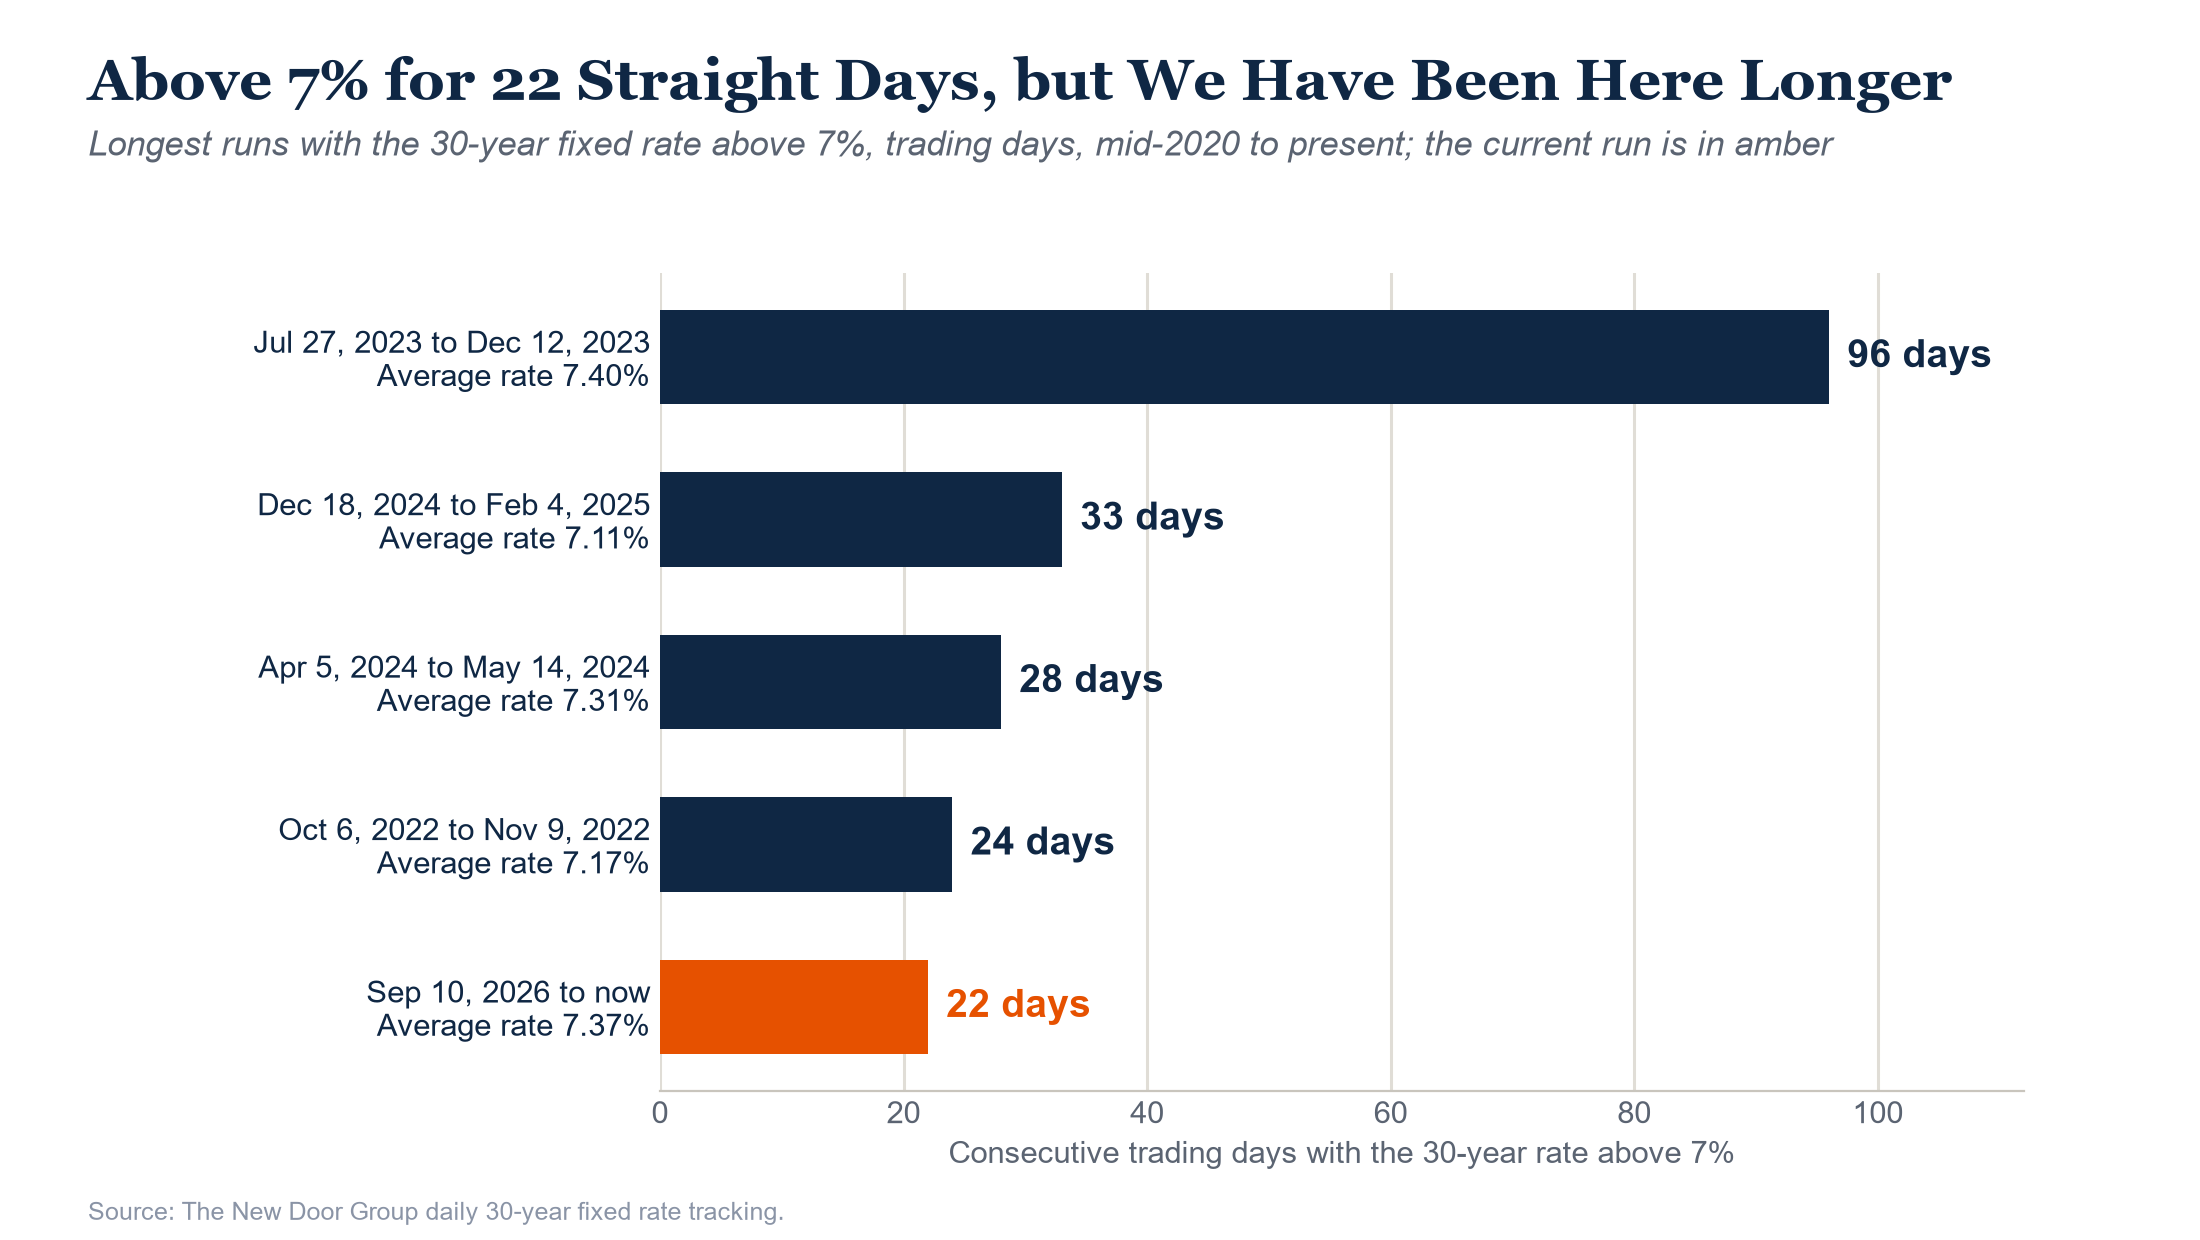
Rates reached 7.61% on Monday, the highest daily reading since Nov 1, 2023 and a new high for 2026, then eased through the week to close Friday at 7.48%. That ended a streak of seven straight weekly increases, the first decline in eight weeks. It is welcome news without being a turning point: rates remain 116 basis points above a year ago, the 4-week average of 7.40% is the highest since November 2023, and the national picture has not caught up yet. Freddie Mac’s weekly survey rose to 7.40% on Thursday from 7.28%, because it averages earlier days in the week, including the peak.
Rates have now stayed above 7% for 22 straight trading days, the fifth-longest run since we began tracking daily rates in mid-2020, and the longest since a 33-day run that ended in February 2025. But we have been here before, and for much longer. The longest stretch above 7% lasted 96 trading days, from July 27 to Dec 12, 2023, and averaged 7.40%. The longest stretch at 7.5% or higher was 23 days, from Oct 2 to Nov 2, 2023, averaging 7.80%; this week’s run at 7.5% or higher lasted 9 days. Stretch the lens wider and the point is clearer: from May 22, 2023 through Feb 21, 2025, 21 months, the 30-year rate averaged 7.02%, and 251 of 440 trading days (57%) were above 7%. The market worked through all of it.
10,918 Showings: The Widest Gap to Last Year Since May 2023
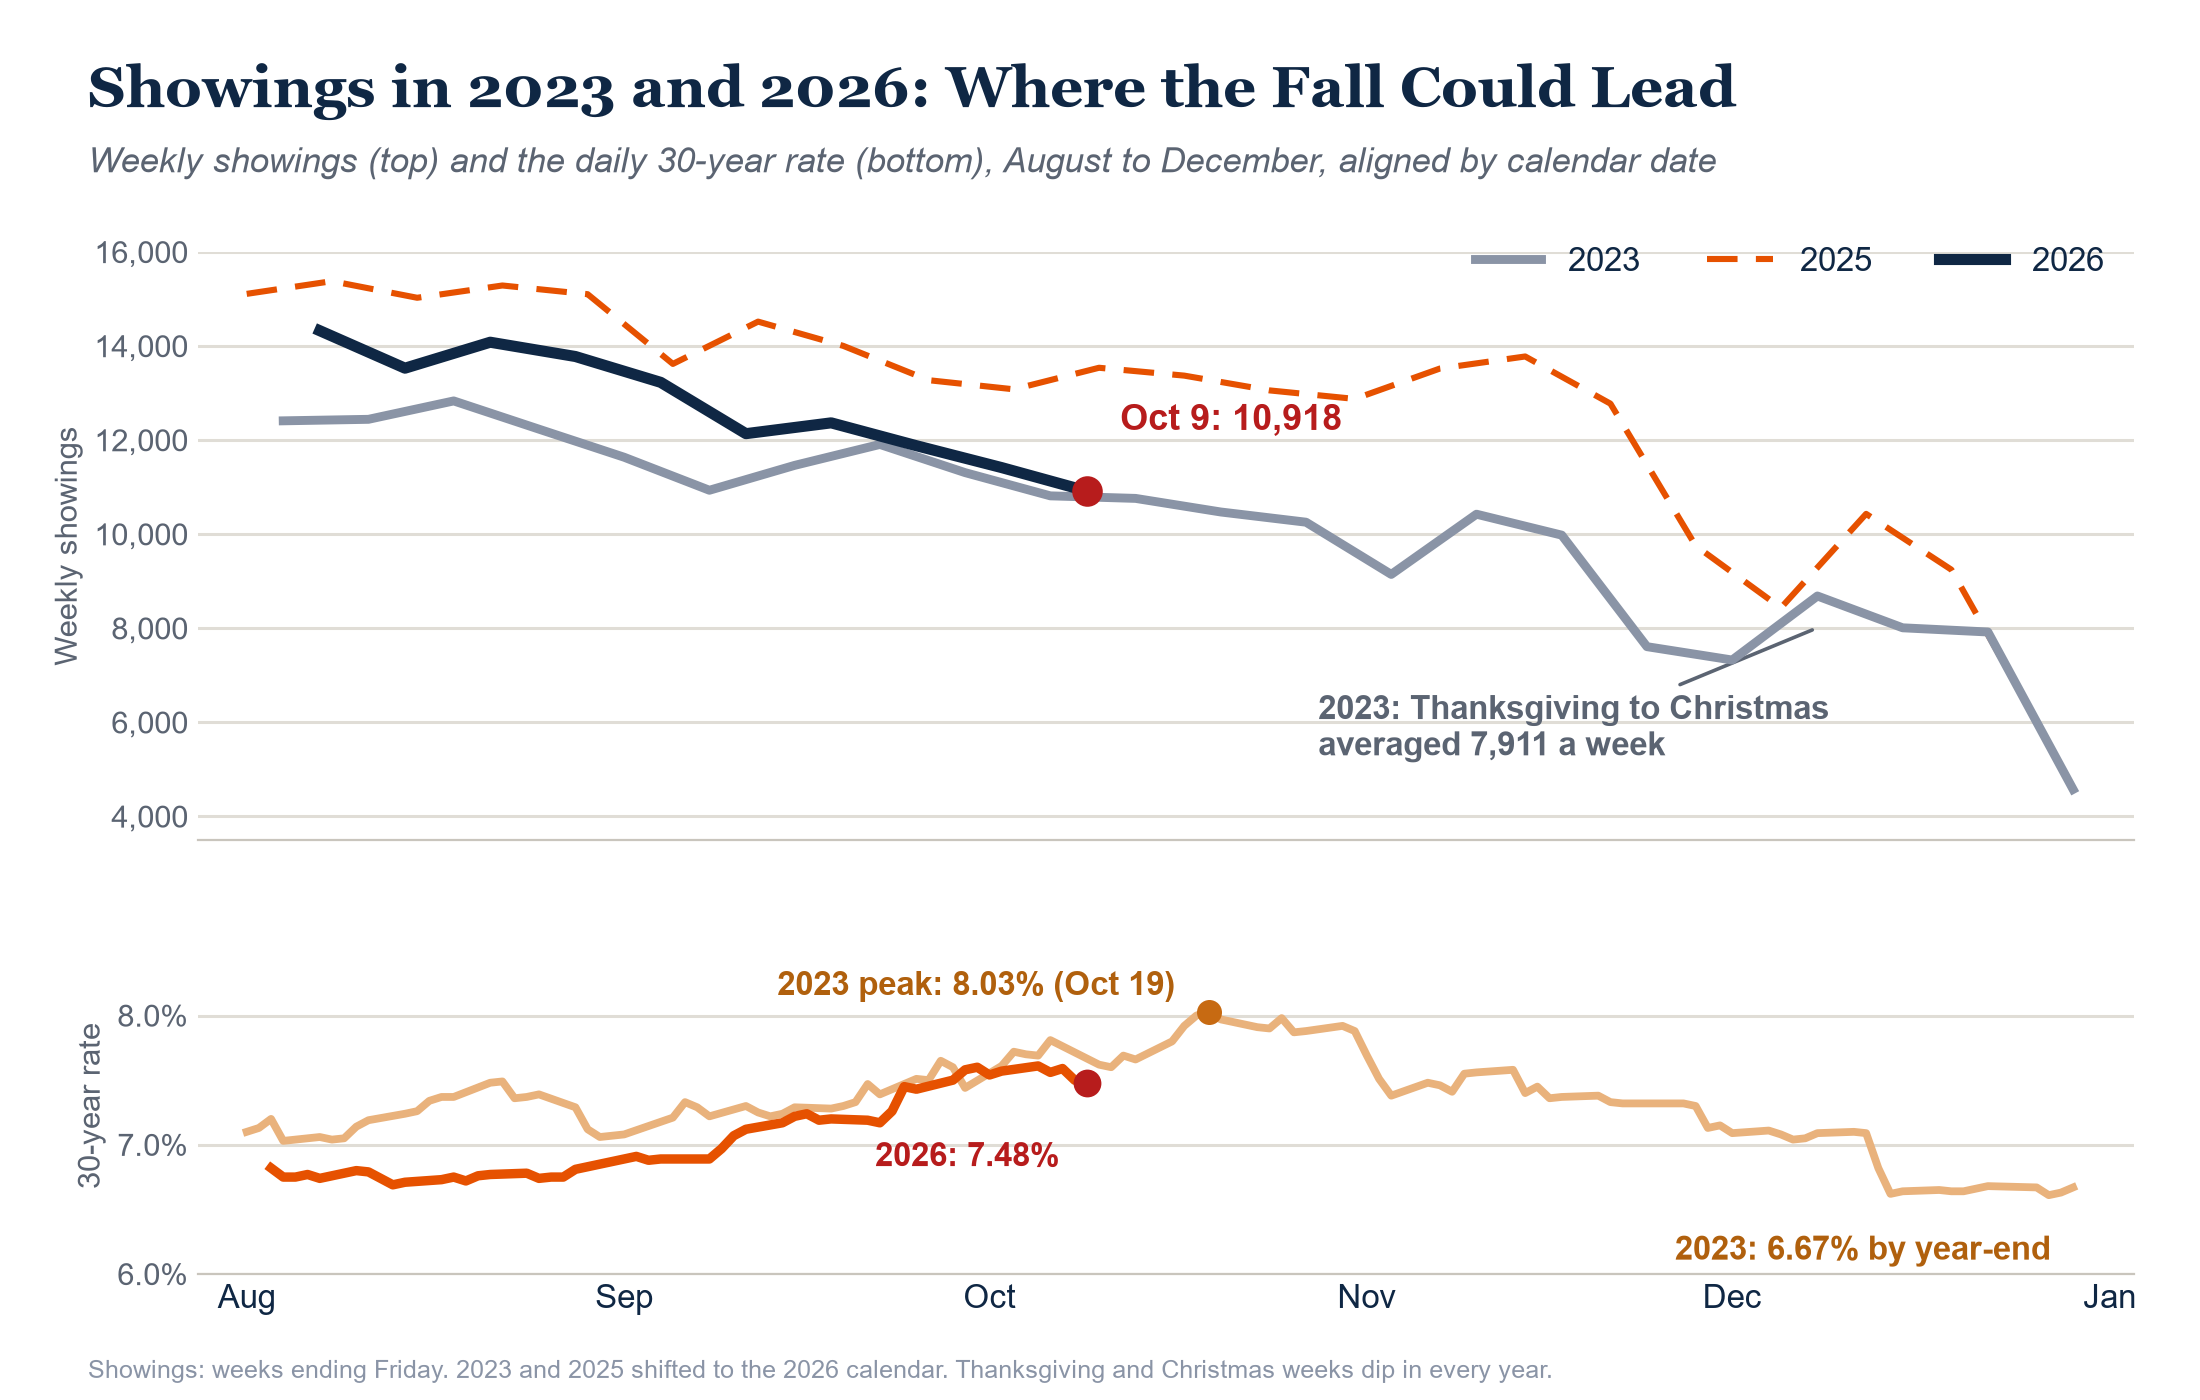
Showings fell 4.4% to 10,918 and are running 19.4% behind last year, the widest gap since the week ending May 19, 2023, when it was 25.9%. The deficit is no longer a one-week story: the last four weeks are down 13.6% (15.1% once Labor Day timing is lined up), and each of the last 14 weeks has trailed last year. Part of the sting is a strong year-ago comparison. Last October ran about 13,000 a week, and showings did not fall below 12,000 until the week of Thanksgiving, seven weeks from now.
The more useful comparison may be 2023, when rates peaked at 8.03% on Oct 19. Showings in early October 2023 (10,816) look almost identical to this week’s. They then fell 27%, averaging 7,911 a week from Thanksgiving through the week before Christmas, even as rates dropped to 6.67% by year-end. In each of the last four years, showings fell between 24% and 30% from early October to the four weeks beginning with Thanksgiving week. Applied to this week’s 10,918, that range points to roughly 7,600 to 8,300 a week before Christmas. So yes, an even weaker holiday stretch than 2023 is possible, especially if rates do not ease the way they did then.
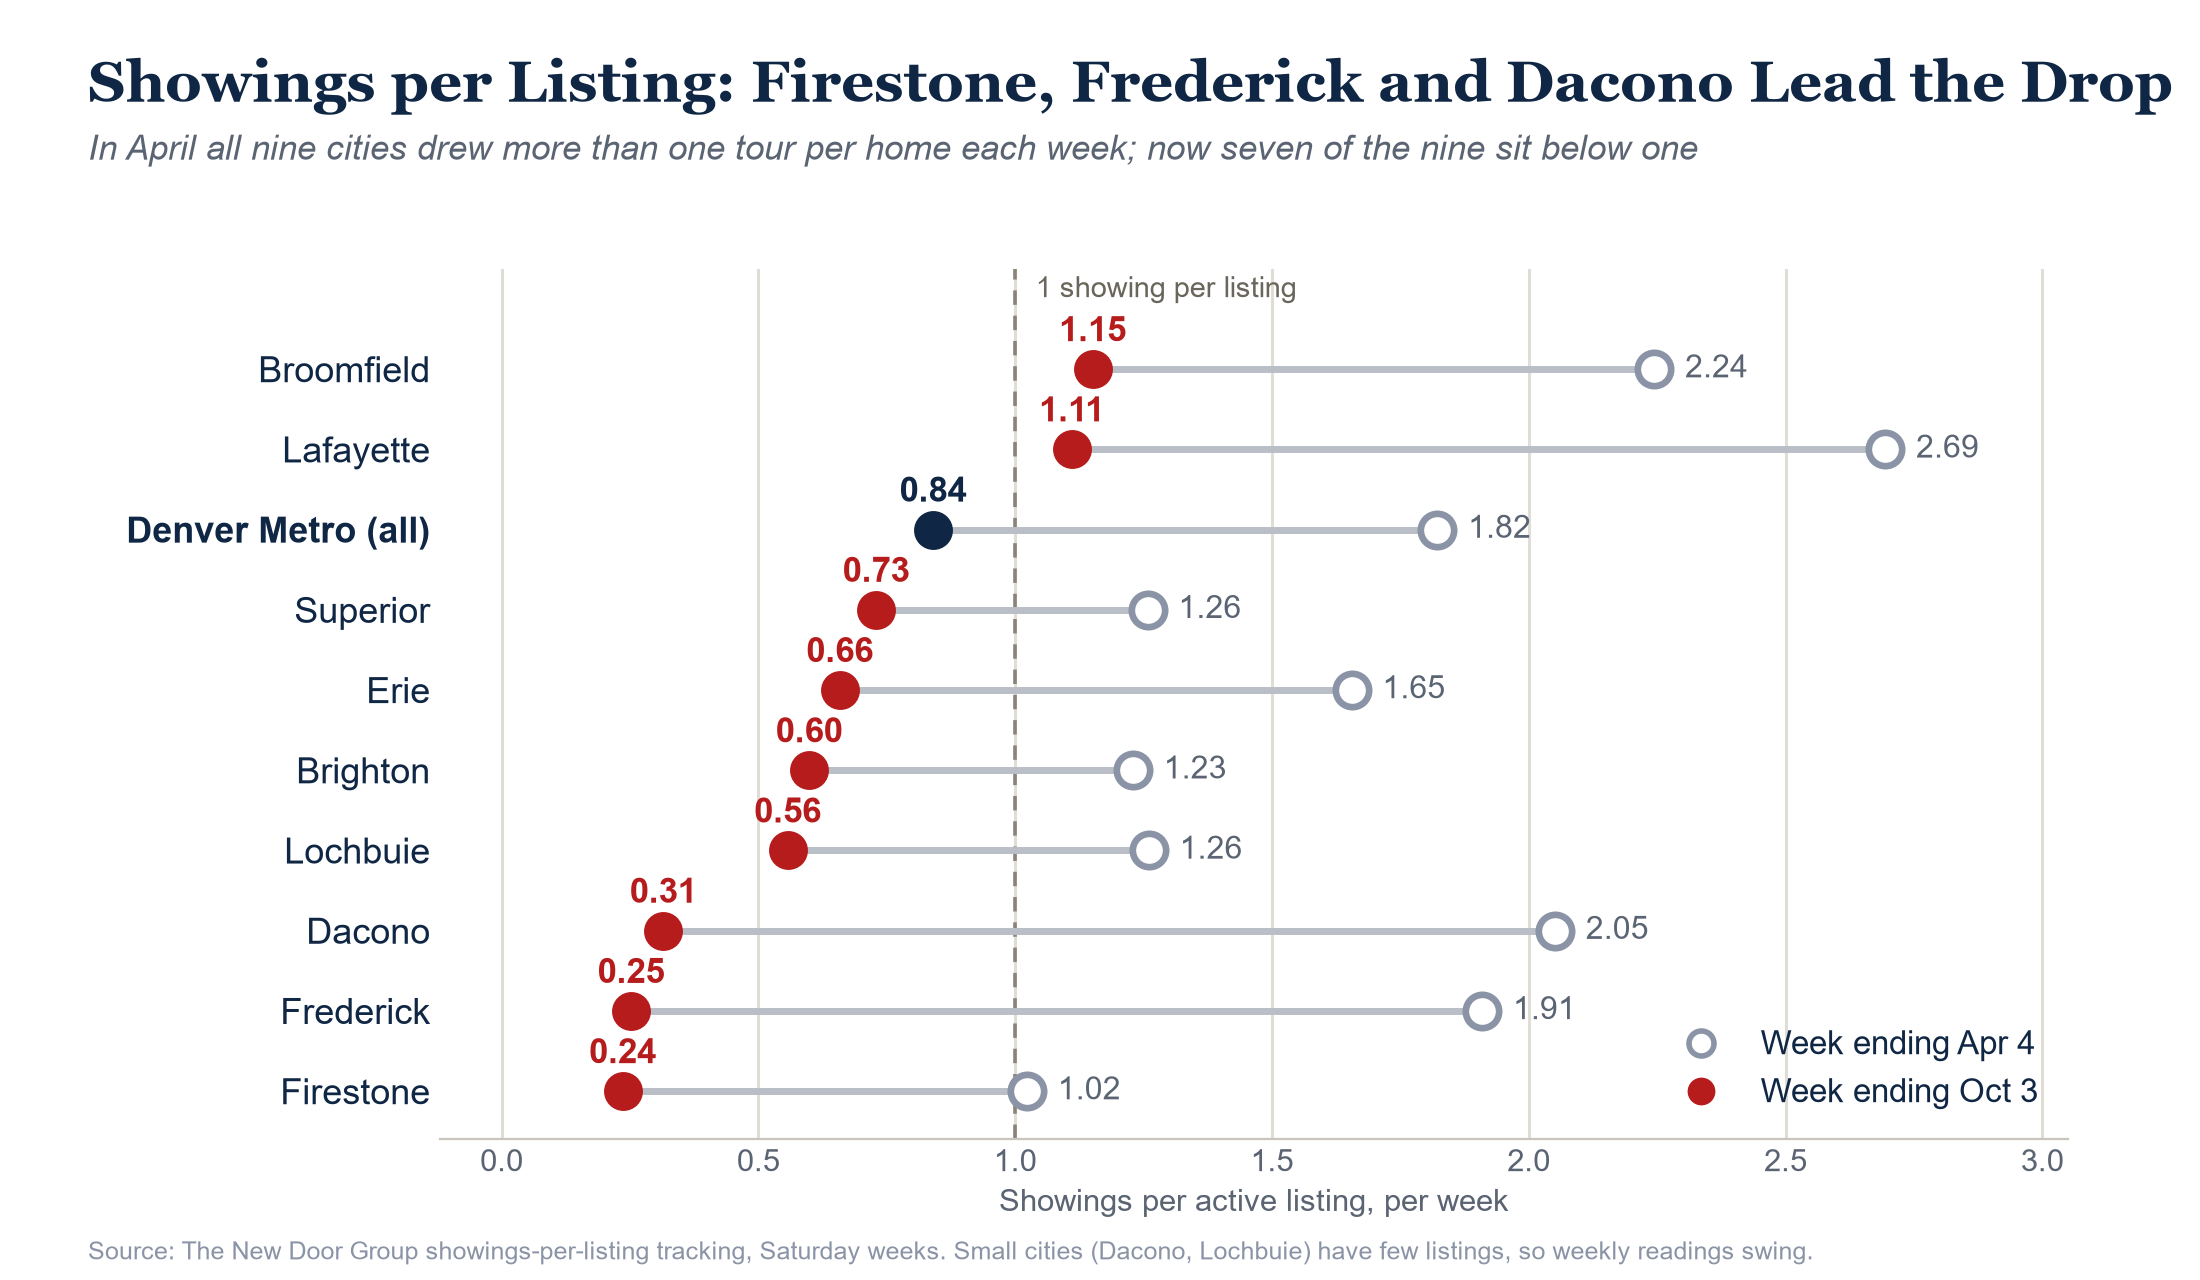
Showings per listing, the number of tours the average home receives each week, fell to 0.84 for the week ending Oct 9: about four showings every five weeks per listing. The weakness is deepest in the northeast part of the metro. In the week ending Oct 3, Firestone (0.24), Frederick (0.25) and Dacono (0.31) had the lowest readings of the 35 cities we track, ahead of Henderson (0.40) and Commerce City (0.51), with Brighton, Lochbuie and Erie all near 0.6. In April, all nine cities in the chart below drew more than one showing per listing. That is notable because several of them, such as Frederick, Dacono, Brighton and Lochbuie, are lower-priced, mostly single-family markets, where affordability-minded buyers would be expected to be most active. Firestone also reached 100 active listings this week, the first time it has hit that mark in our tracking. We do not have a clean explanation yet for why these cities in particular are so quiet.
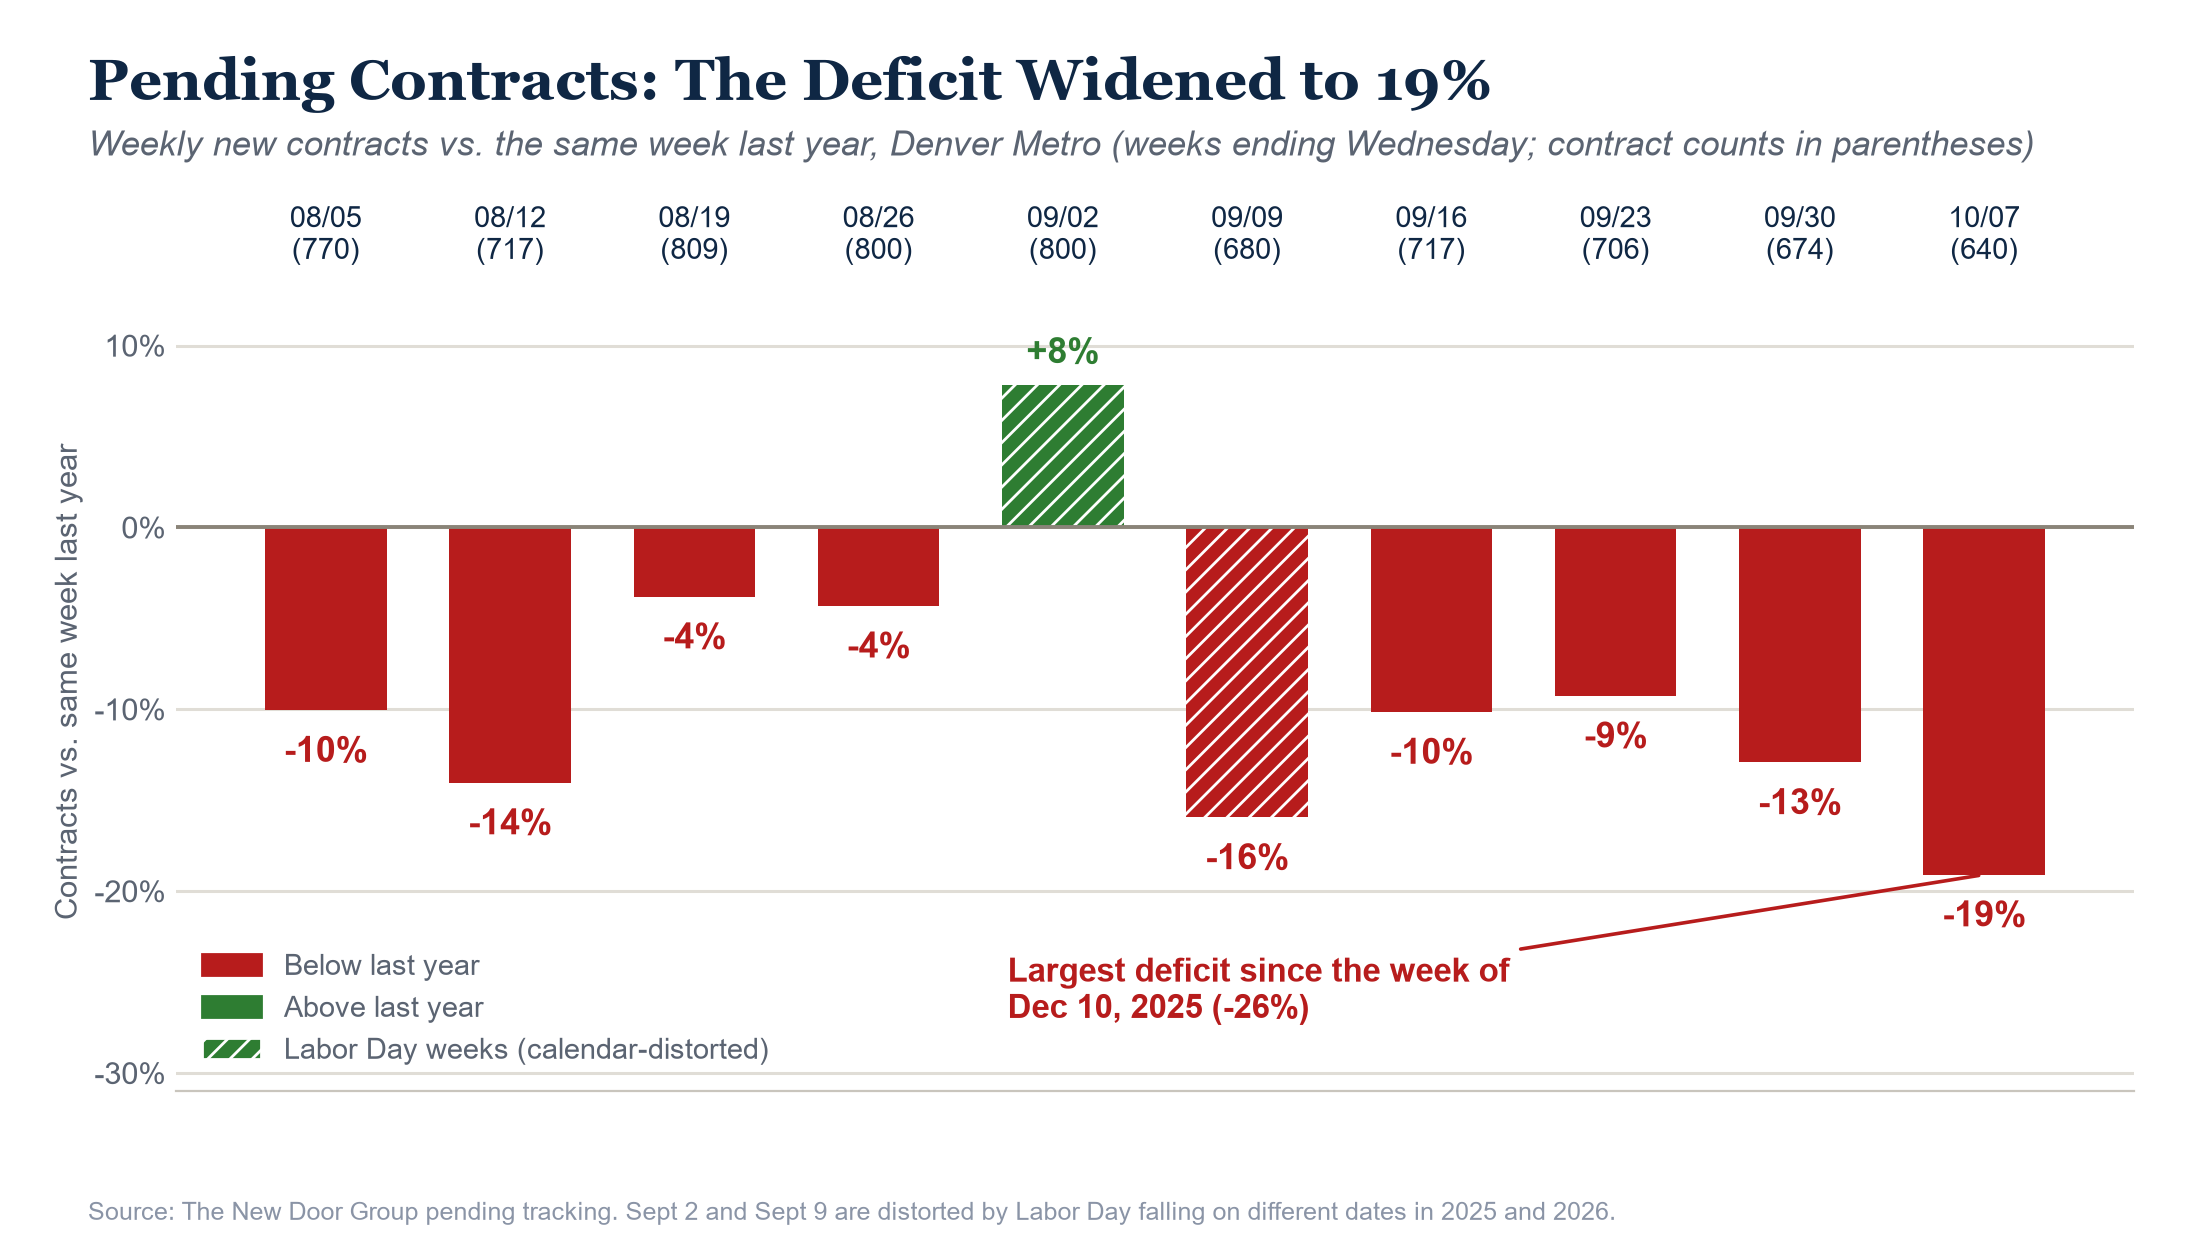
640 New Contracts: Down 19.1%, the Deepest Deficit Since December
Contracts fell for the third straight week and finished 19.1% behind last year, the largest deficit since the week of Dec 10, 2025 (-26.2%). Single-family contracts were down 20.8% and attached contracts down 11.8%. A single week can exaggerate: last year’s matching week (791) was one of its stronger ones, and the four-week deficit of 12.9% is the steadier read. But that four-week number is itself wider than the 12.1% we reported last week and the 8.0% reported in late August, so the direction is clear. Showings usually lead contracts by a week or two, and showings have now trailed last year for 14 straight weeks.
New Listings Down 9.5% for a Third Week, and Inventory Holds Near Its High
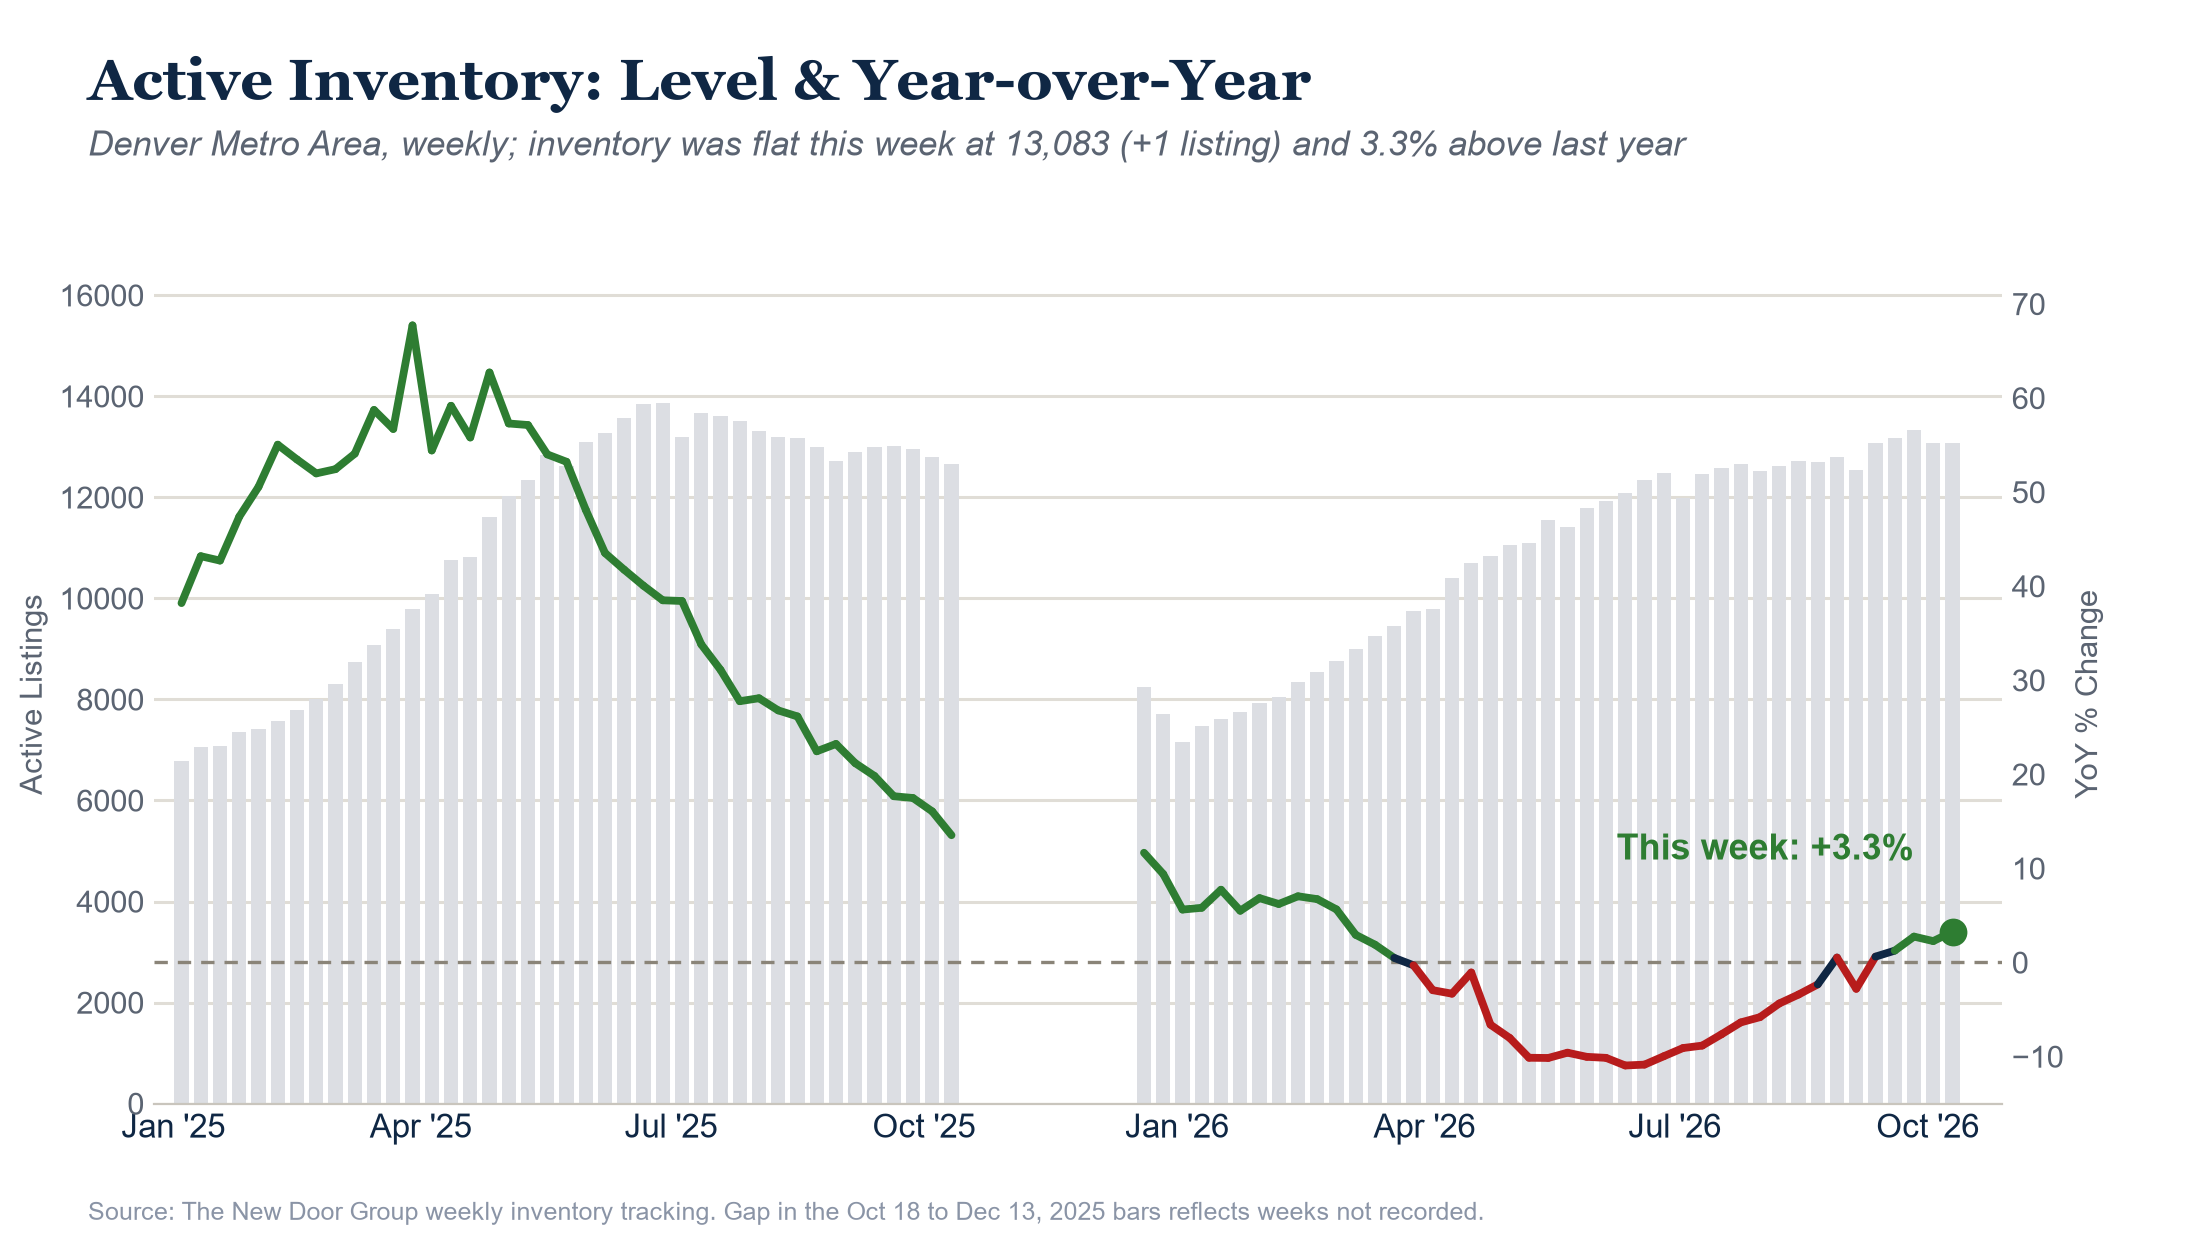
New listings totaled 999, the lowest total for a week without a holiday since February (969), and the third straight week roughly 10% behind last year (-9.6%, -10.0% and -9.5%). Sellers who would also have to buy at 7.5% have little reason to list this fall, and the numbers keep showing it. Even so, inventory did not follow new listings lower: it was essentially flat at 13,083, up a single listing, and 3.3% above last year, a wider lead than last week’s 2.3% because last year’s inventory was still falling at this point in the season (down 122 in the matching week). Homes are leaving the market more slowly than they are arriving, which is what thin demand looks like.
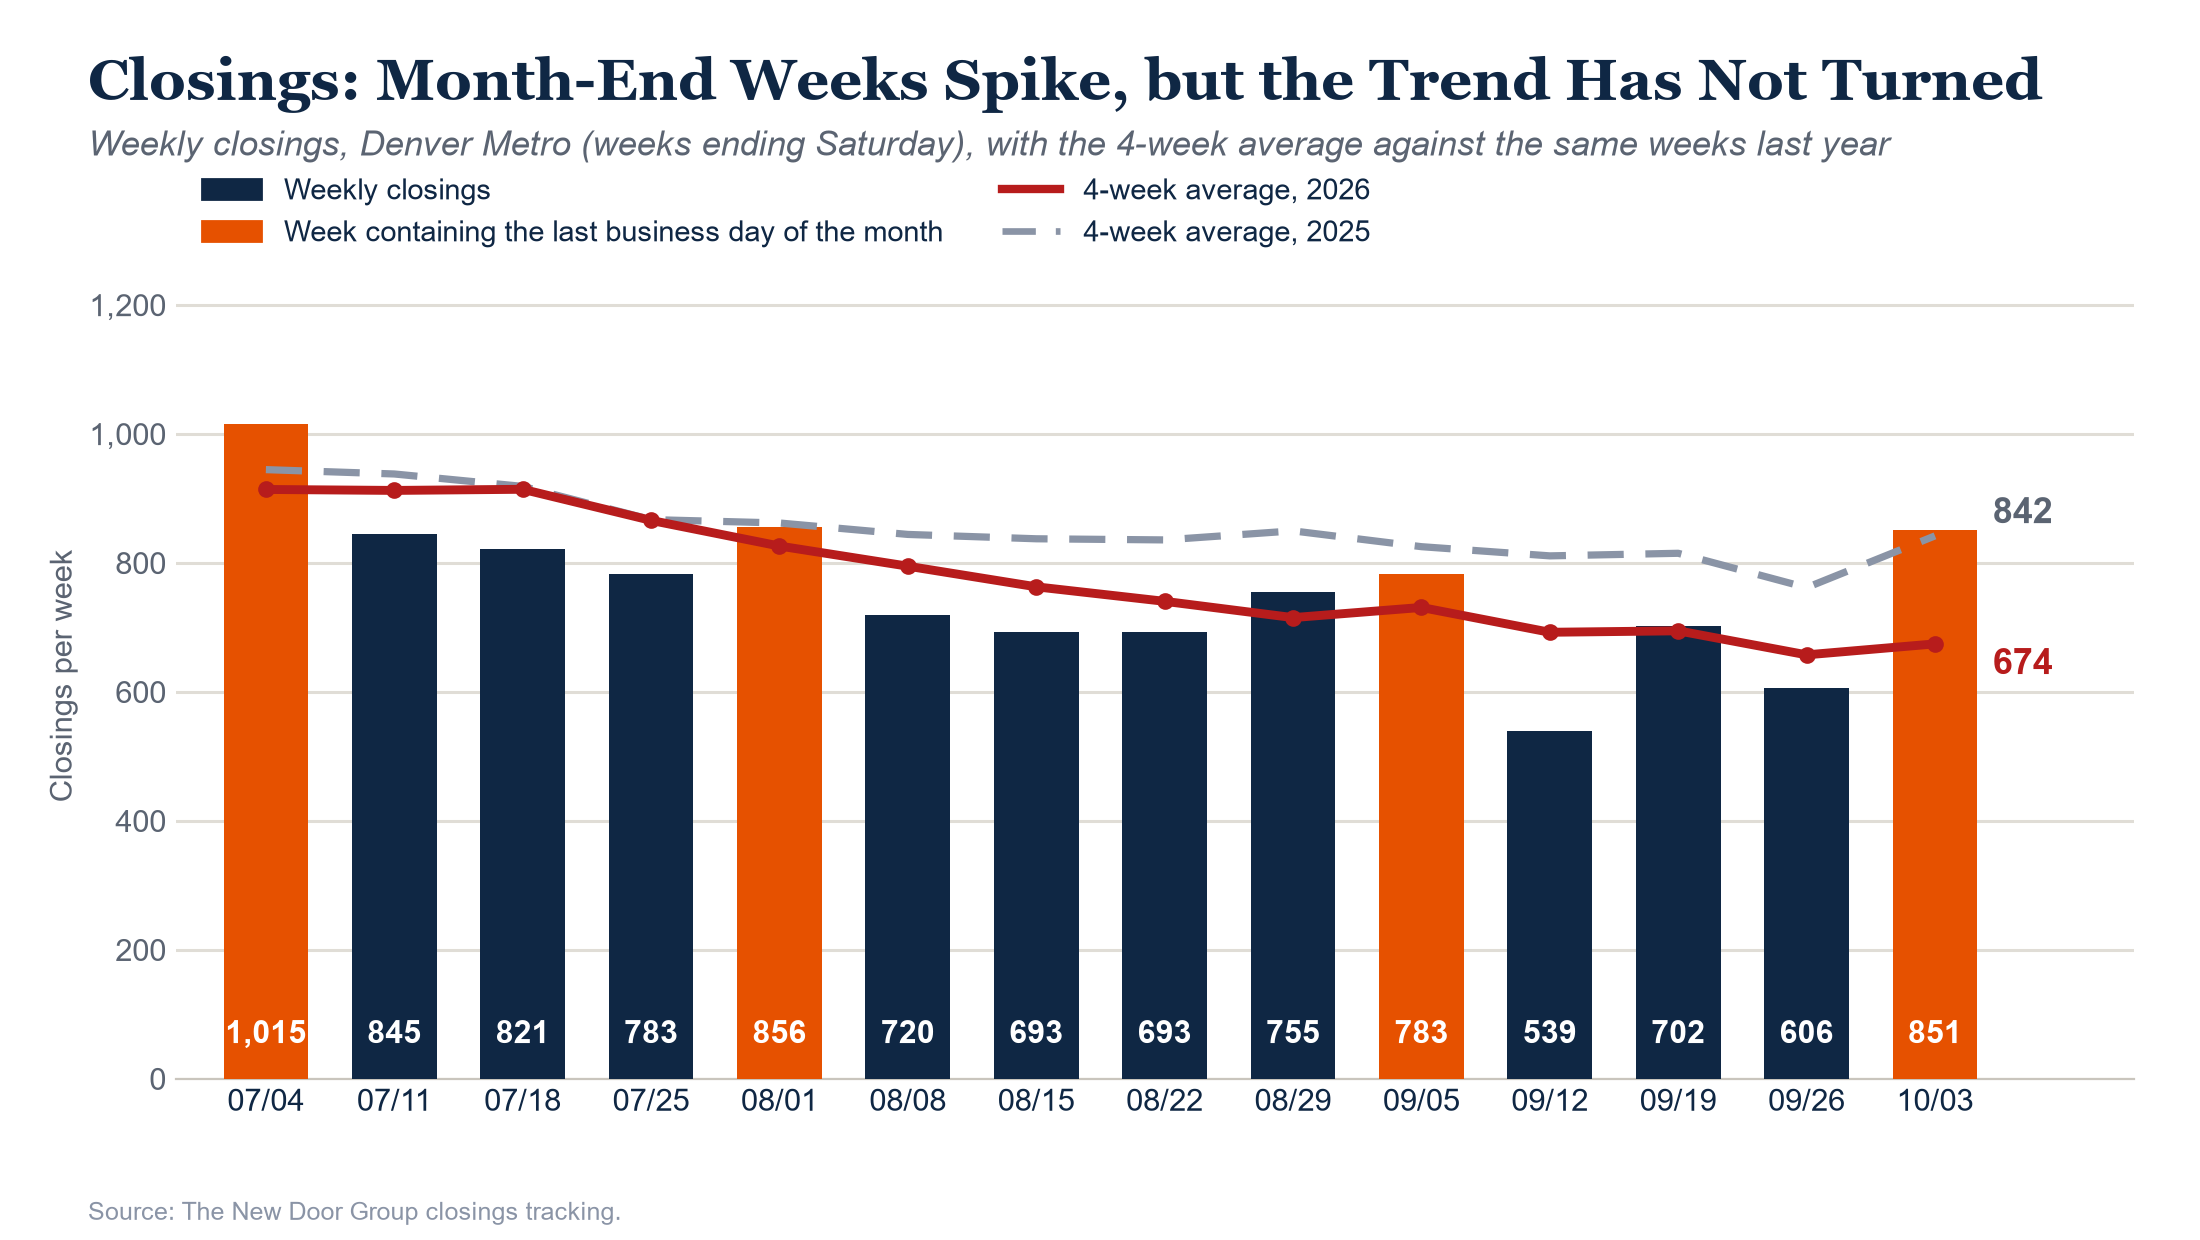
851 Closings: A Month-End Spike, Not a Turn
Closings jumped from 606 to 851, the most in a week since Aug 1, but most of that is the calendar. Closings cluster in the final days of the month, and the week that holds the last business day of the month has averaged 26% more closings than the four weeks around it since January 2024 (excluding November and December, when holidays distort the pattern). In 26 of those 28 months, the month-end week ran at least 10% higher. This week’s 851 is about 30% above the average of the two weeks before it, right in line with the usual bump. The same week last year, which also contained a month-end, had 993 closings, so even with the boost this week was 14% behind.
The better read is the 4-week average, which smooths the month-end effect. The last four weeks averaged 674 closings, down 7.7% from the four weeks before and 19.9% below the same four weeks last year (842 a week). The average ticked up slightly from last week only because the month-end week entered the window; it has not turned. Beneath the metro number is a wide spread by city: over the last eight weeks closings are down 41% in Lakewood, 40% in Erie, 38% in Centennial and 37% in Highlands Ranch, while Littleton (+8%), Broomfield (+15%) and Arvada (+1%) are holding at or above last year.
Closed MSI Improved Everywhere, but the Contract-Based Read Slipped
Closed months of supply fell in every category (all property types from 5.07 to 4.85, single-family from 4.24 to 4.09, condos from 10.09 to 9.58, townhomes from 5.89 to 5.53), but it should not be read as the market tightening. The measure divides inventory by the last four weeks of closings, and this week the 851-closing month-end week replaced a thinner one in that window. The 539-closing week from mid-September also still sits in the window and leaves it next week, which would flatter the figure further. Pending MSI, which uses contracts and looks ahead, moved the other way, edging up in every category (all types from 4.56 to 4.60, single-family 3.79 to 3.83, condos 9.36 to 9.55, townhomes 5.41 to 5.55). Small moves, but all in the direction of more supply per contract.
Sellers Are Not Blinking: Reductions Track Last Year as Demand Thins
The share of listings with a price reduction rose 0.5 point this week and 2.6 points over the last four weeks (from 56.5%), so reductions are growing. But last year’s share rose too, about 2.0 points over the same stretch, which is why the gap to last year has barely moved: -1.1, -0.6, -0.5, -0.3 and now -0.5 points. That is a surprisingly calm reading with rates 116 basis points above a year ago, inventory up 3.3% and showings down nearly 20%. The cuts themselves have deepened only modestly, averaging 6.3% of list price this week versus 6.2% a month ago, and listings are not sitting much longer: the average active listing has been on the market 102 days, up about five days since mid-July.
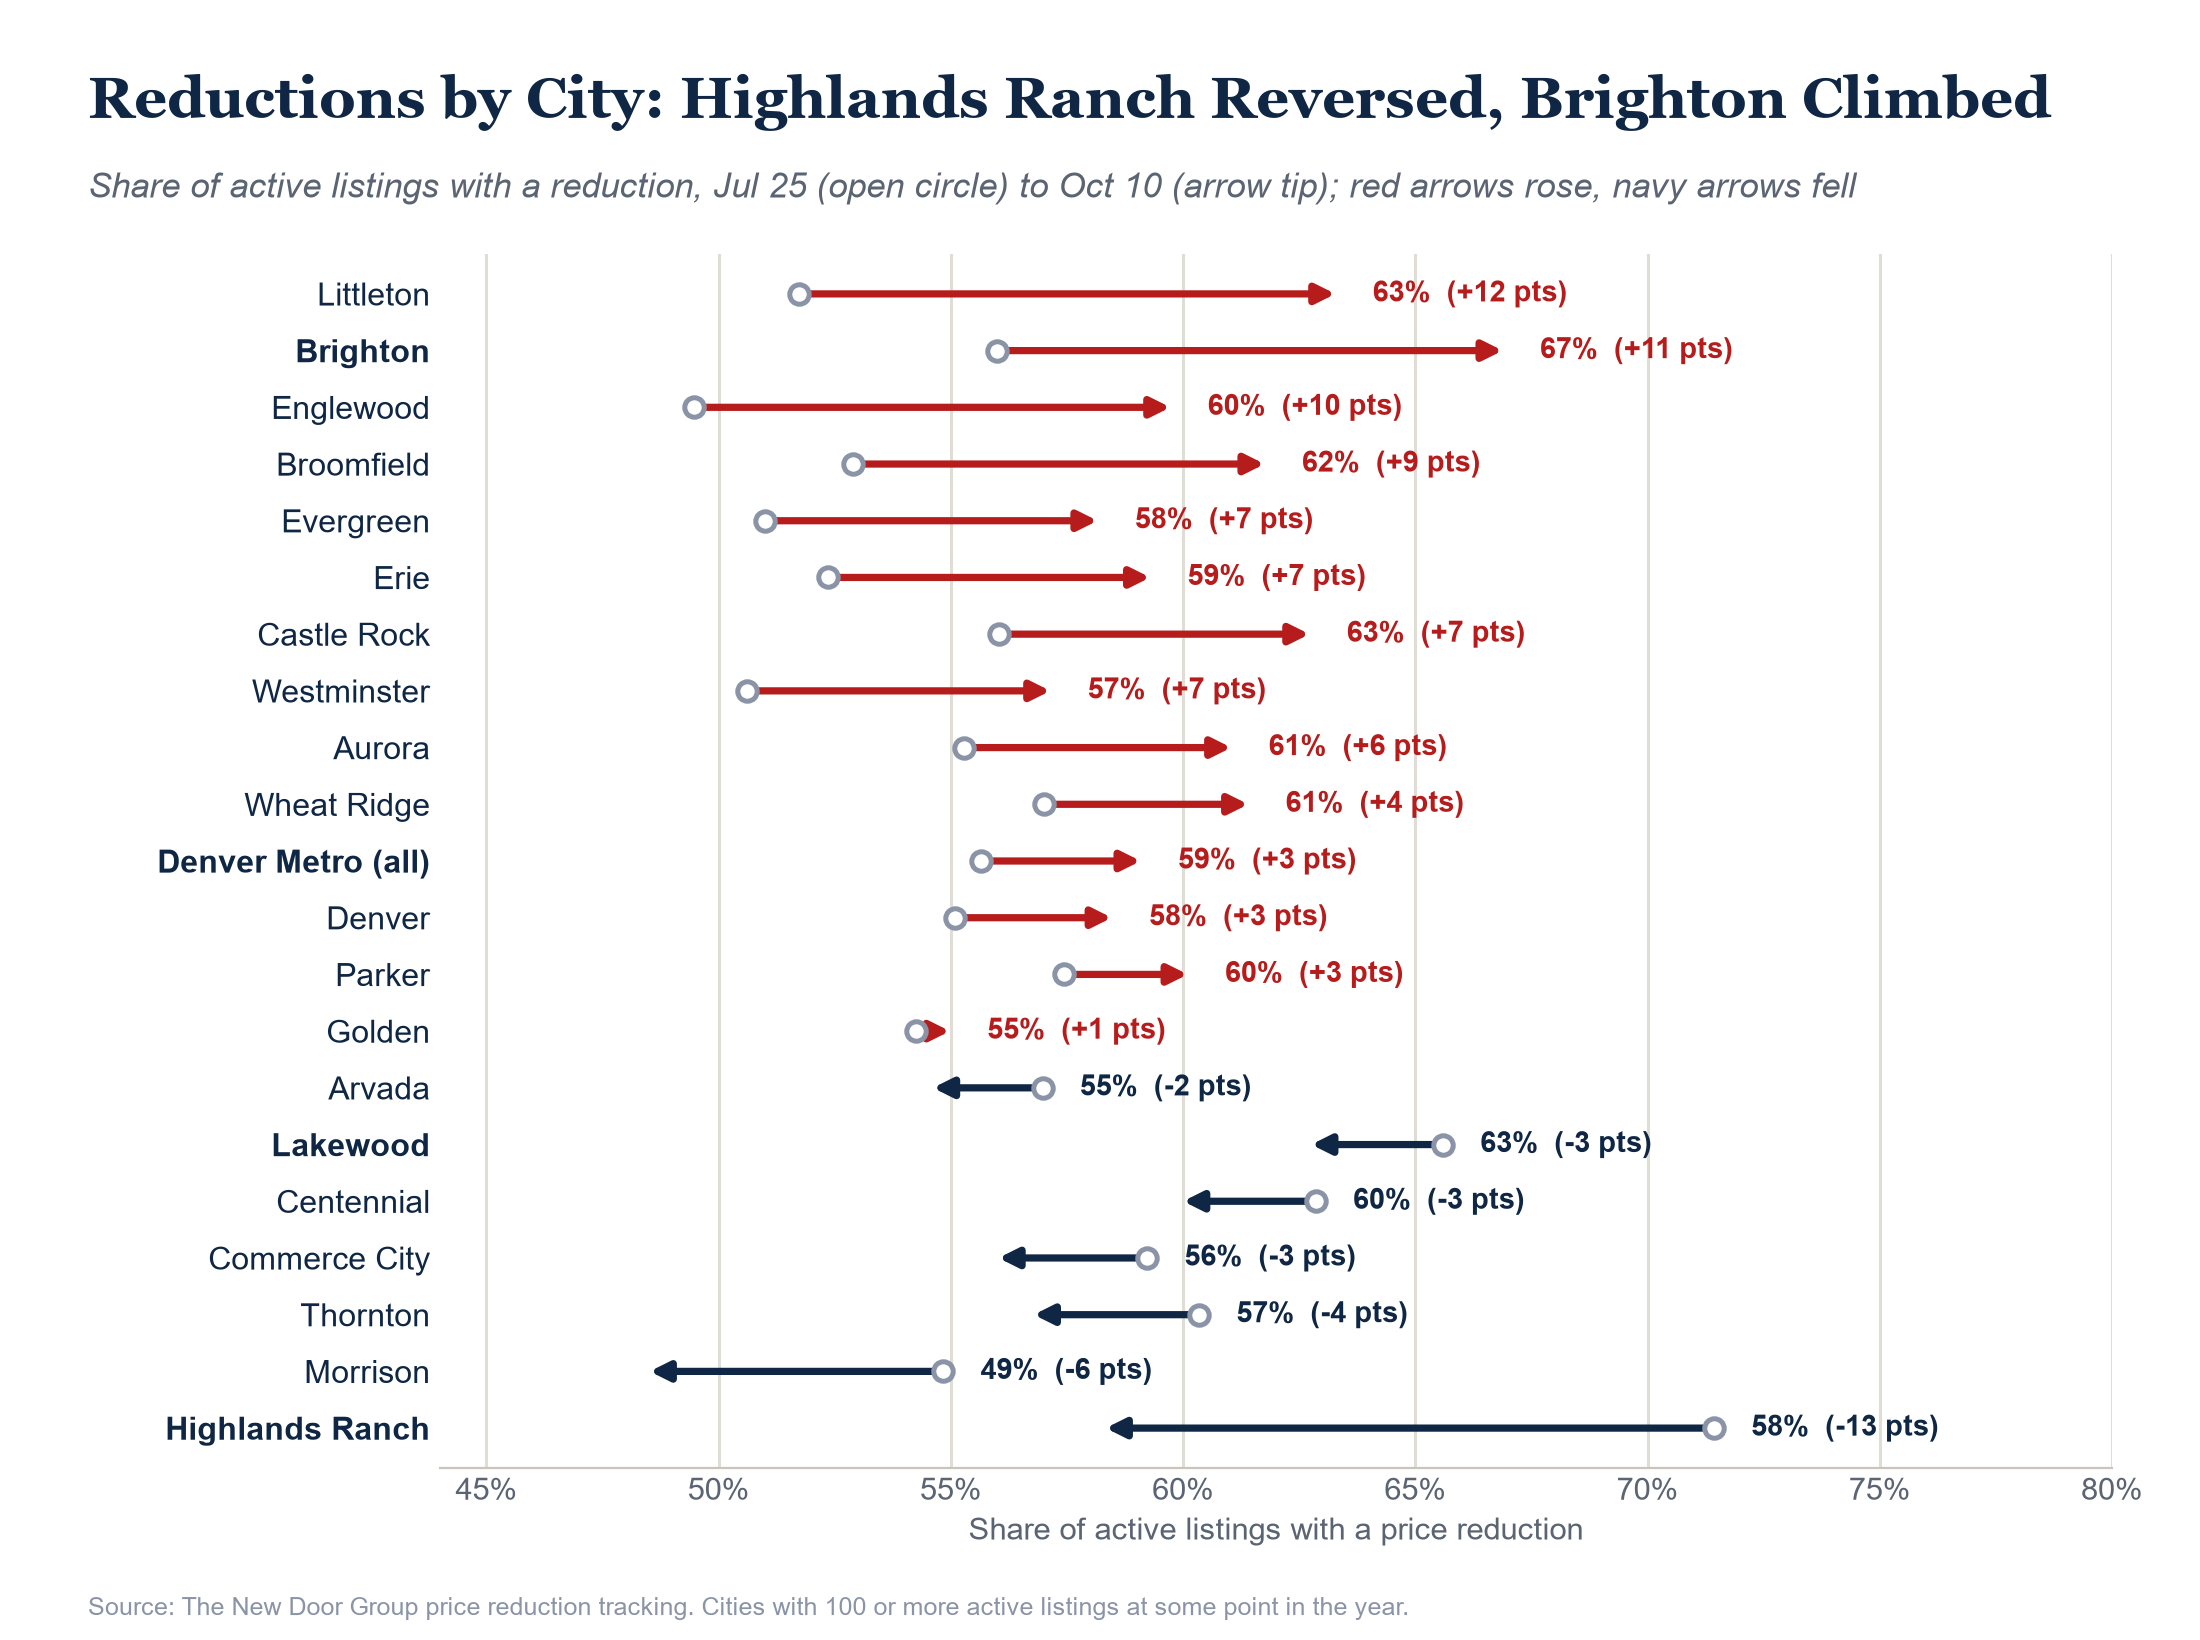
The city detail shows where the pressure is building. Since late July, the share of listings with a reduction has climbed 12 points in Littleton, 11 in Brighton, 10 in Englewood and 9 in Broomfield, while it has fallen in Highlands Ranch, from a peak of 73% in mid-August to 58%, and in Lakewood, from 71% to 63%. There is a pattern behind it: across the 17 cities with a full year of tracking, the ones whose inventory has grown the most compared with last year are, broadly, the ones where reductions are rising fastest (a moderate relationship, with a correlation of about 0.6), and the cities with the tightest supply, Highlands Ranch and Centennial, are where reductions are easing.
We also checked Firestone, Frederick and Dacono, which we had not tracked before because their listing counts stayed under 100. As of the week ending Oct 3, they are not following Brighton on how often sellers cut: 51% of Firestone’s listings and 51% of Frederick’s had a reduction, below where they stood in July (61% for both), and Dacono, with only 36 listings, sits near 69%. What has changed is depth. Average cuts have grown from 4.4% to 5.3% in Firestone, from 2.9% to 4.1% in Frederick and from 3.9% to 7.3% in Dacono since early July. Sellers there are cutting less often but by more when they do.
Expirations jumped to 760, but the week included the last day of the month, which always produces the largest expiration count of any week. The better test is month-end against month-end: 760 is 6.7% above the 712 of a year ago, and it equals 5.7% of average daily active listings, the highest reading since the week containing the new year. That share has risen at each of the last five month-ends (3.4% in early May, then 4.0%, 4.1%, 4.4%, 5.2% and now 5.7%). Expirations are running above last year, but with reductions matching last year’s pace we see no sign of real seller stress or fatigue yet. Sellers are choosing to wait, not being forced to move.
The Big Picture: Demand Is Thinning Quickly, but Sellers Are Still Holding
Buyer demand is weakening on every front at once. Showings are 19.4% behind last year, the widest gap since May 2023, contracts are 19.1% behind, and showings per listing are down to 0.84, with some northeast markets drawing fewer than one tour every three weeks. The closing data, which lags by 30 to 45 days, is still catching up, and the 851-closing week was mostly the calendar.
Sellers have not yet reacted. Reductions are tracking last year, expirations are only modestly higher, and many would-be sellers are staying out entirely, with new listings down 9.5%. That standoff cannot last indefinitely. Either sellers begin to give ground, which would show up first in expirations, deeper reductions and the cities where inventory is growing, or rates ease enough to bring buyers back, as they did late in 2023. The 2023 slump is the cautionary tale: showings fell about 27% into the holidays even as rates dropped. If rates do not ease, the same seasonal decline from today’s level could carry showings below 8,000 a week.
Call check, showings and pendings (graded: right): in August we called for the pending deficit to persist because showings were weakening, to be graded if the showings deficit worsened past -15%. It is -19.4% in a clean, unaffected week, and the pending deficit has widened to -19.1%.
Call check, active inventory: inventory is +3.3% year over year, so the call for it to stay positive through year-end remains on track.
Call check, mortgage rates: we called for rates not to close below 6.75% through Dec 31. At 7.48%, they are 73 basis points above that floor. On track.
Call check, sellers giving ground: half of the test is met: month-end expirations were up 6.7% from last year, above September’s 3.9%. The other half is not: reductions are still slightly below last year (59.1% vs. 59.6%). The Oct 31 month-end week decides it. Still open.
Call check, closings: the 8-week total ending Oct 3 is 5,622, down 15.7% from last year (6,669). We called for at least a 10% deficit through the 8 weeks ending Nov 21. On track.
New call: we expect showings to average fewer than 8,000 a week for the four weeks ending Nov 27, Dec 4, Dec 11 and Dec 18, matching or beating the 2023 slump (7,908 over its equivalent weeks, versus 9,468 in 2025). We will grade it on that four-week average: right if it comes in under 8,000, wrong if it stays above.