

Mortgage rates climbed for a seventh straight week, and buyers keep answering the same way: fewer tours, fewer contracts, and fewer new listings from sellers who would rather wait. Showings have now trailed last year for 13 straight weeks, pending contracts are running roughly 12% behind, and the closing data, which reflects deals struck before the worst of the rate climb, already shows what that early weakness looks like at the closing table. Sellers, for now, are not showing stress: price reductions are tracking last year and inventory slipped this week. Whether fewer listings can offset fewer buyers is the question we keep coming back to. That continues the thread from last week’s update.
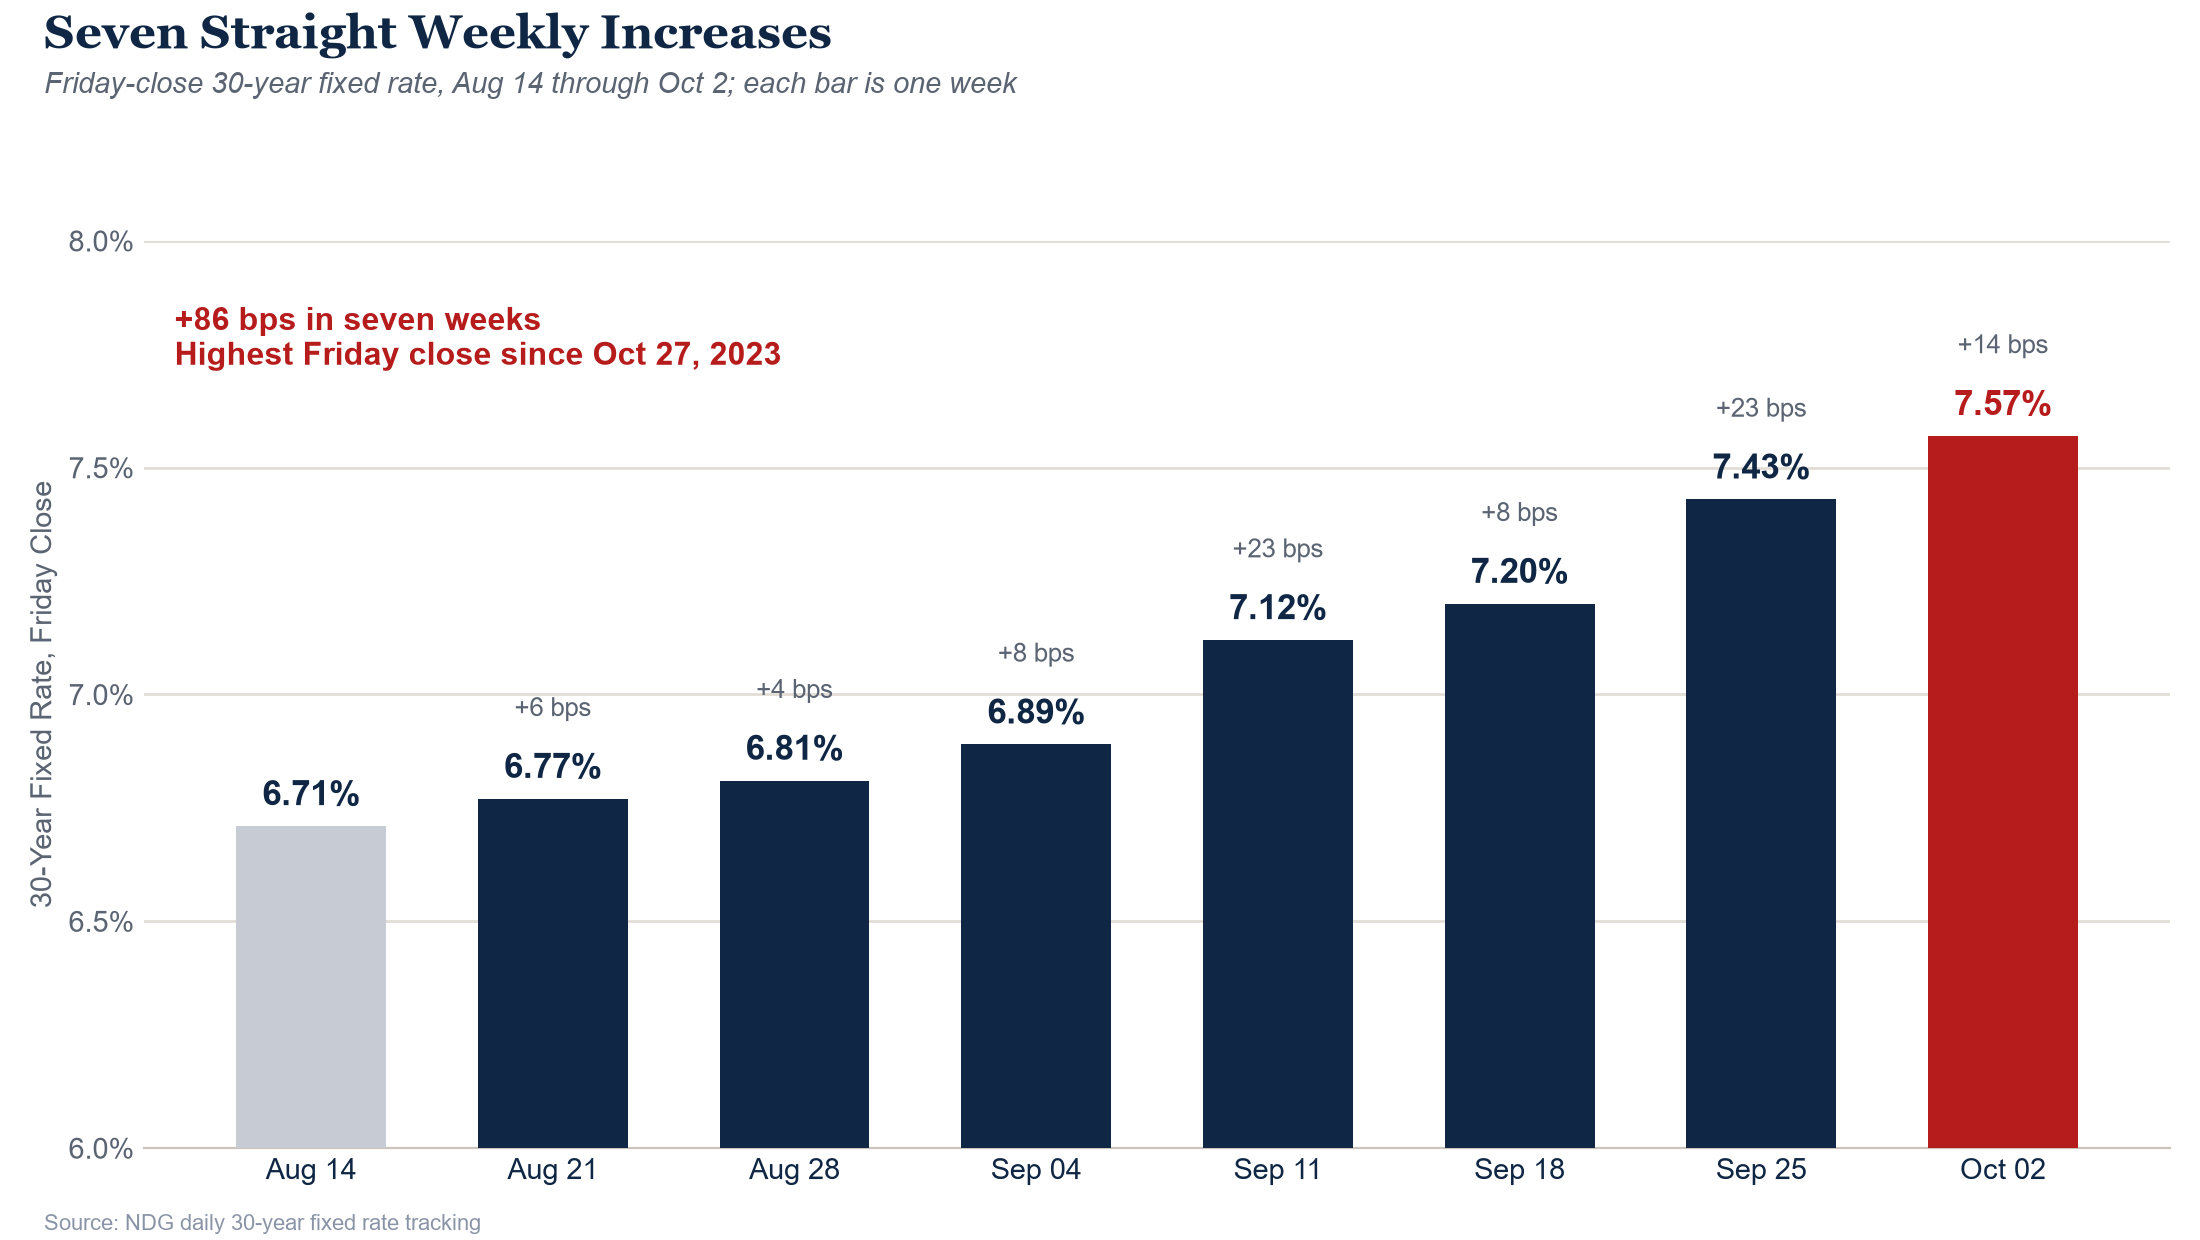
7.57%: Seven Straight Weekly Increases
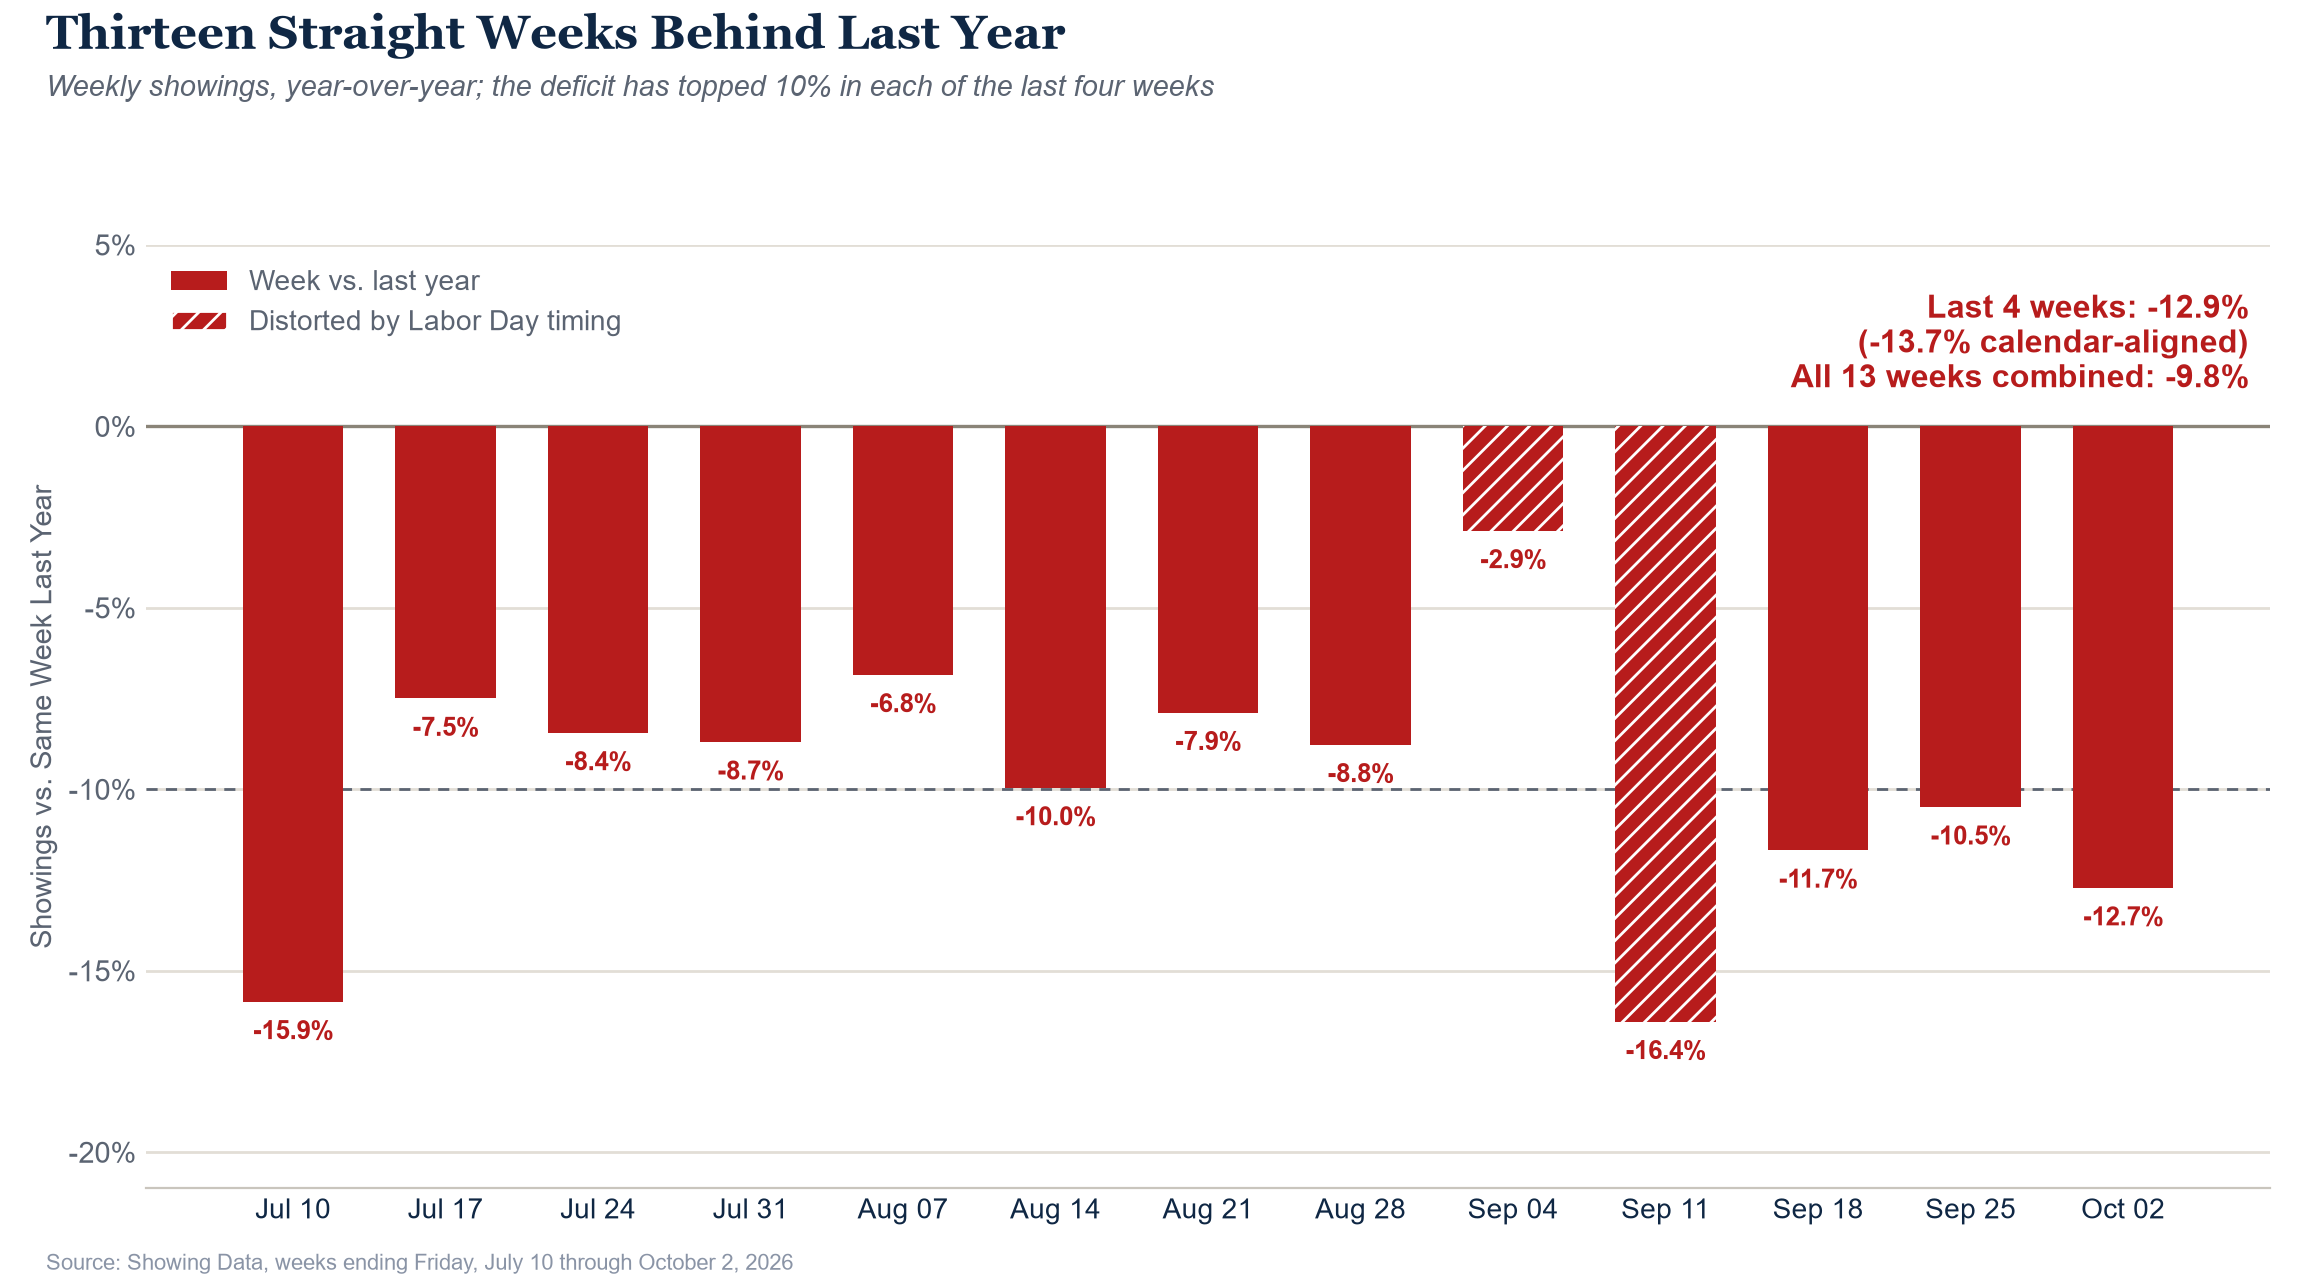
11,417 Showings: The 13th Straight Week Behind Last Year
Showings have now trailed last year for 13 consecutive weeks, down 9.8% over that stretch. The pace of the decline has picked up: each of the last four weeks has run more than 10% behind last year, and the four weeks combined are down 12.9%. Because Labor Day fell later this year than last, a straight comparison slightly flatters the recent weeks; lining them up by their position around the holiday puts the four-week deficit at 13.7%.
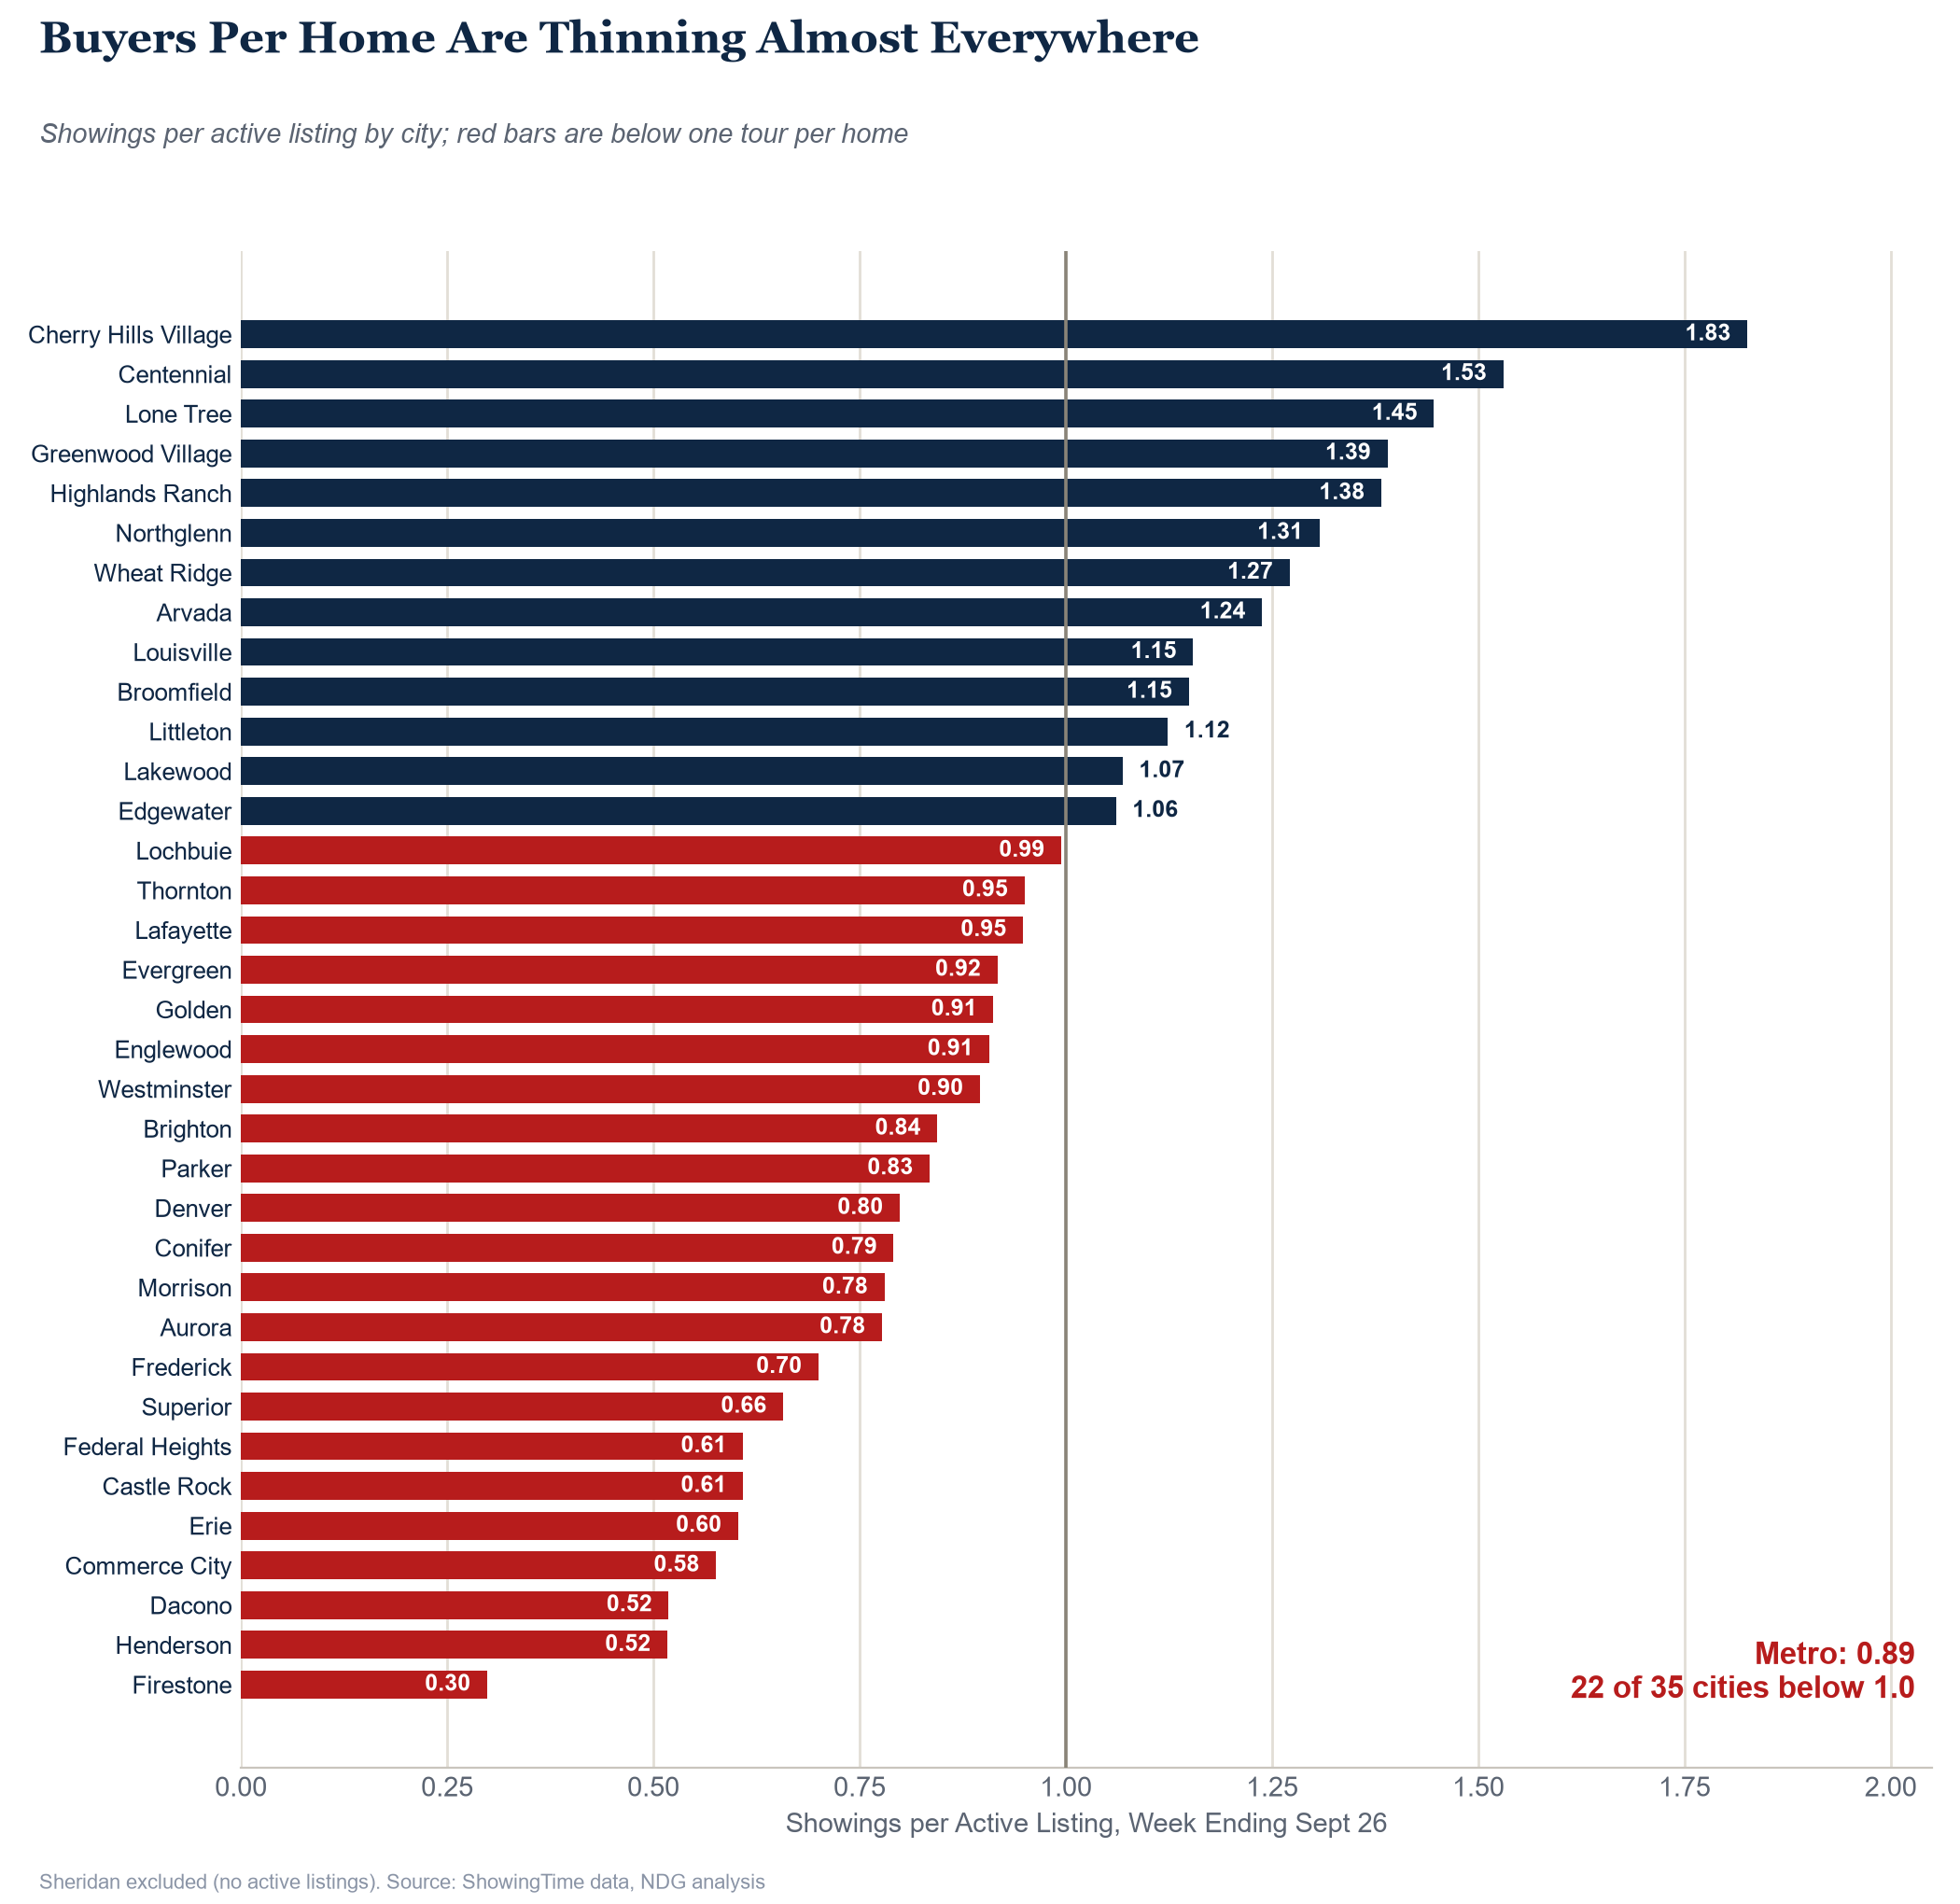
The thinner crowd shows up in showings per listing, which averaged 0.89 across the metro for the week ending Sept 26, the third straight week below one tour per home. Two months ago, 11 of the 35 cities we track sat below 1.0. Now it is 22 of 35. Denver (0.80) and Aurora (0.78), the two largest markets, are both well below the line, while pockets of the south metro, such as Cherry Hills Village, Centennial, Lone Tree, Greenwood Village and Highlands Ranch, and Arvada still draw more than one tour per home.
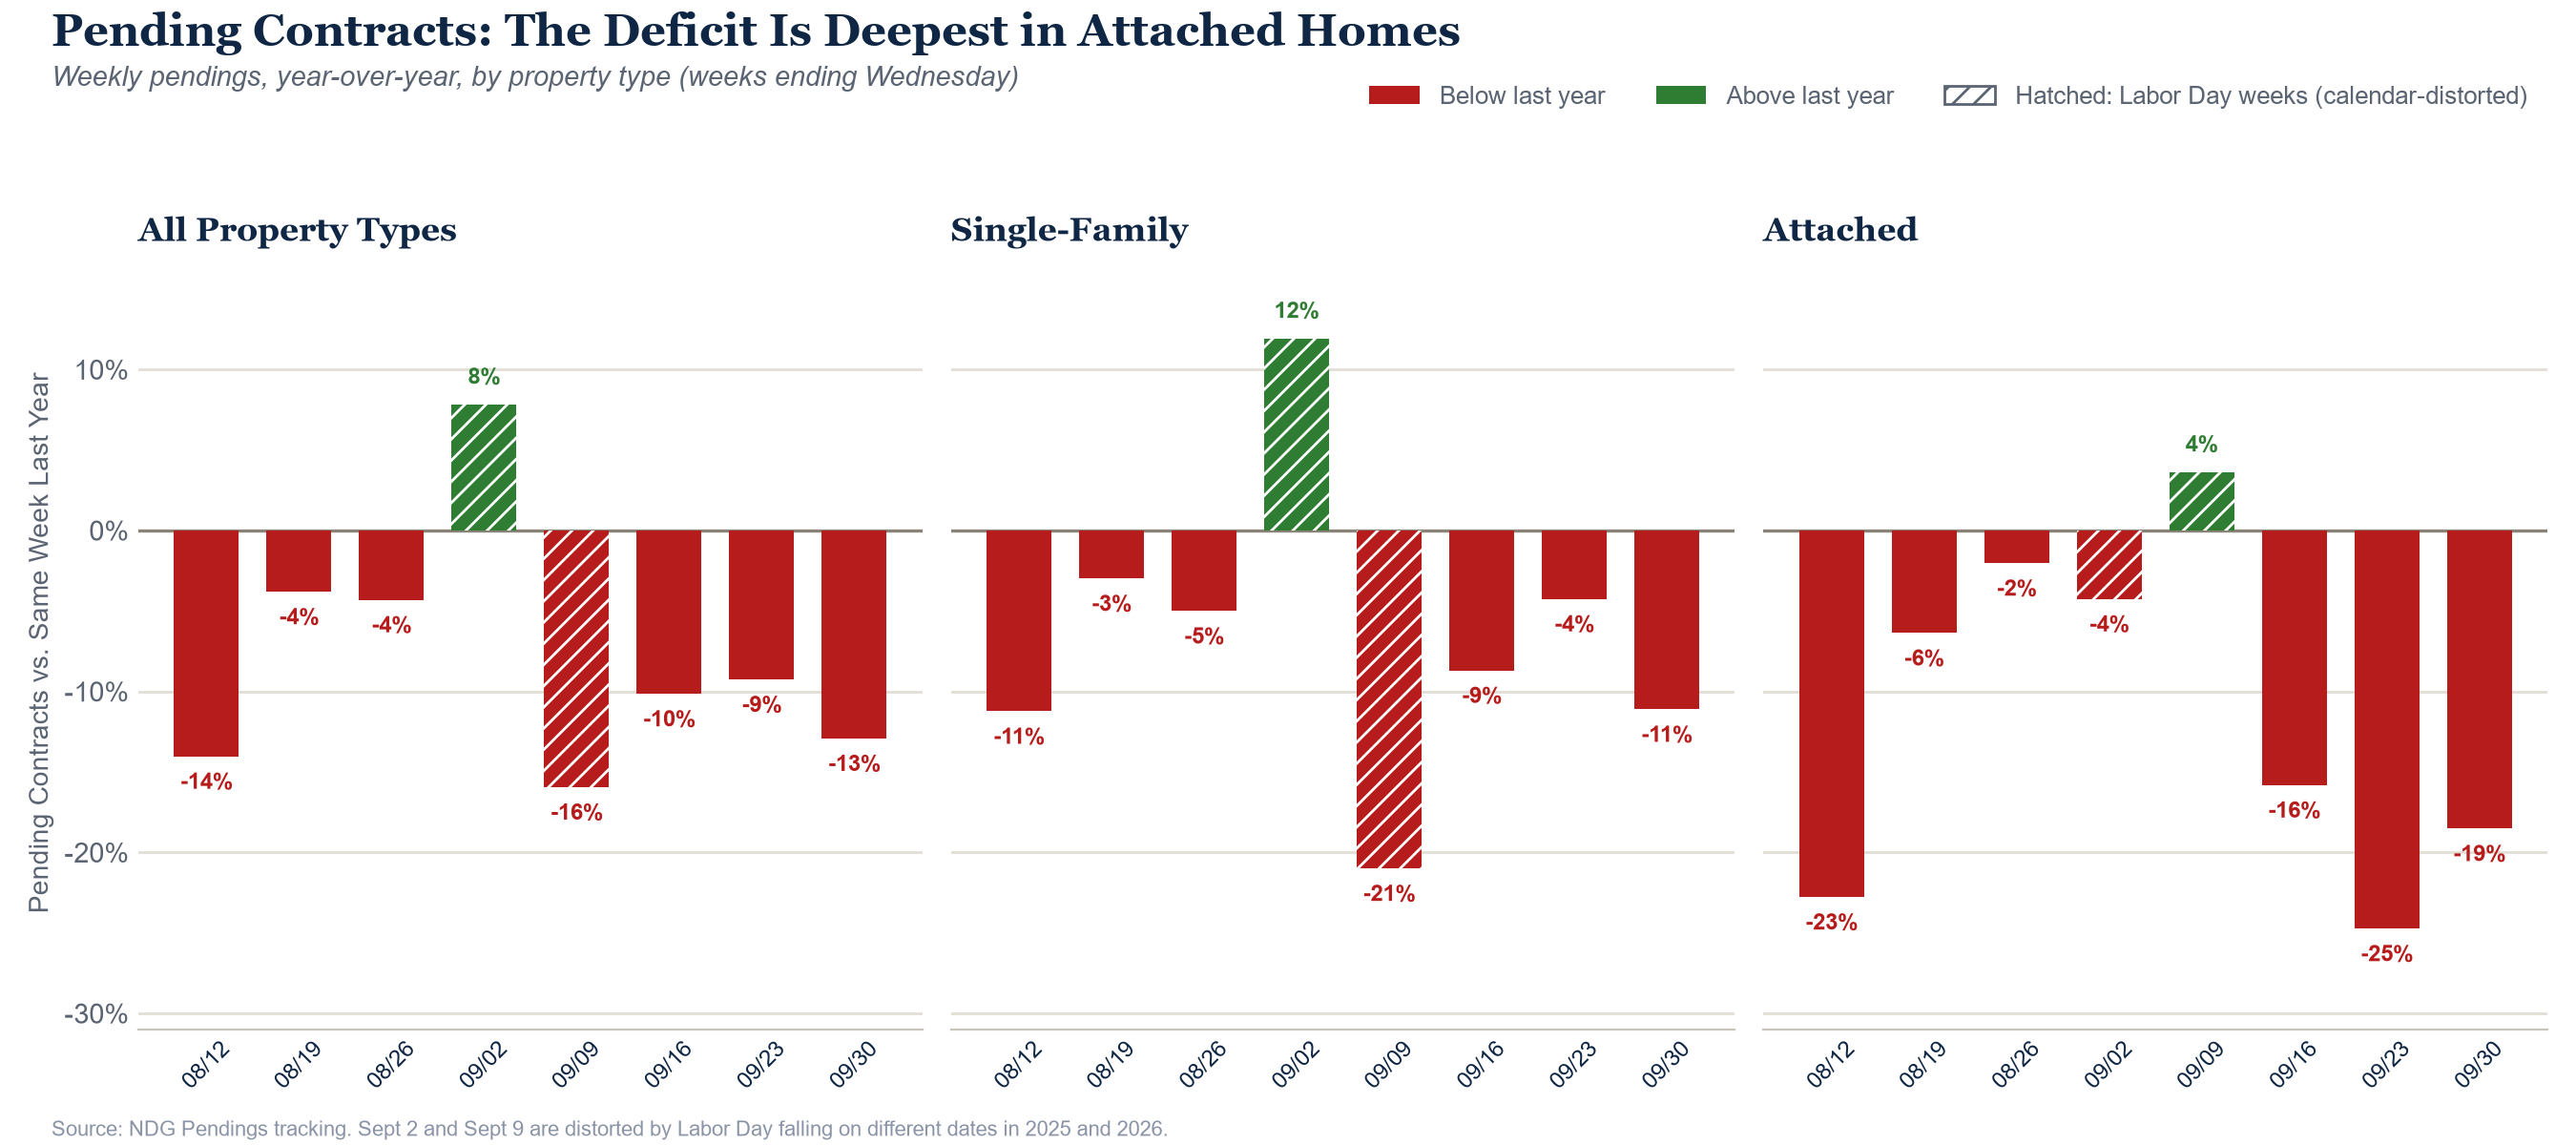
674 New Contracts: Down 12.9% From Last Year
Contracts are being written at a slower pace than a year ago, and the gap has widened since late summer. The four weeks ending Aug 26 ran 8.0% behind last year; the four weeks ending Sept 30 ran 12.1% behind (11.2% once the Labor Day timing difference is removed). Single-family contracts, down 11.1% this week, posted their largest deficit since mid-August, setting aside the two weeks distorted by Labor Day. The weakest segment is attached homes: 154 contracts, down 18.5% from last year after a 24.7% decline the week before and 15.8% the week before that, three straight weeks at 15% or worse.
Sellers Are Listing Less: New Listings Down 10%, Inventory Slips
New listings fell for the second straight week against last year, down 9.6% and then 10.0%, with single-family listings down 13.1% and attached listings essentially flat. For the year to date, new listings are 4.5% behind 2025. With rates at 7.5%, a homeowner who would also have to buy at today’s rates has little reason to list this fall, and the numbers suggest a growing number of them are choosing to wait.
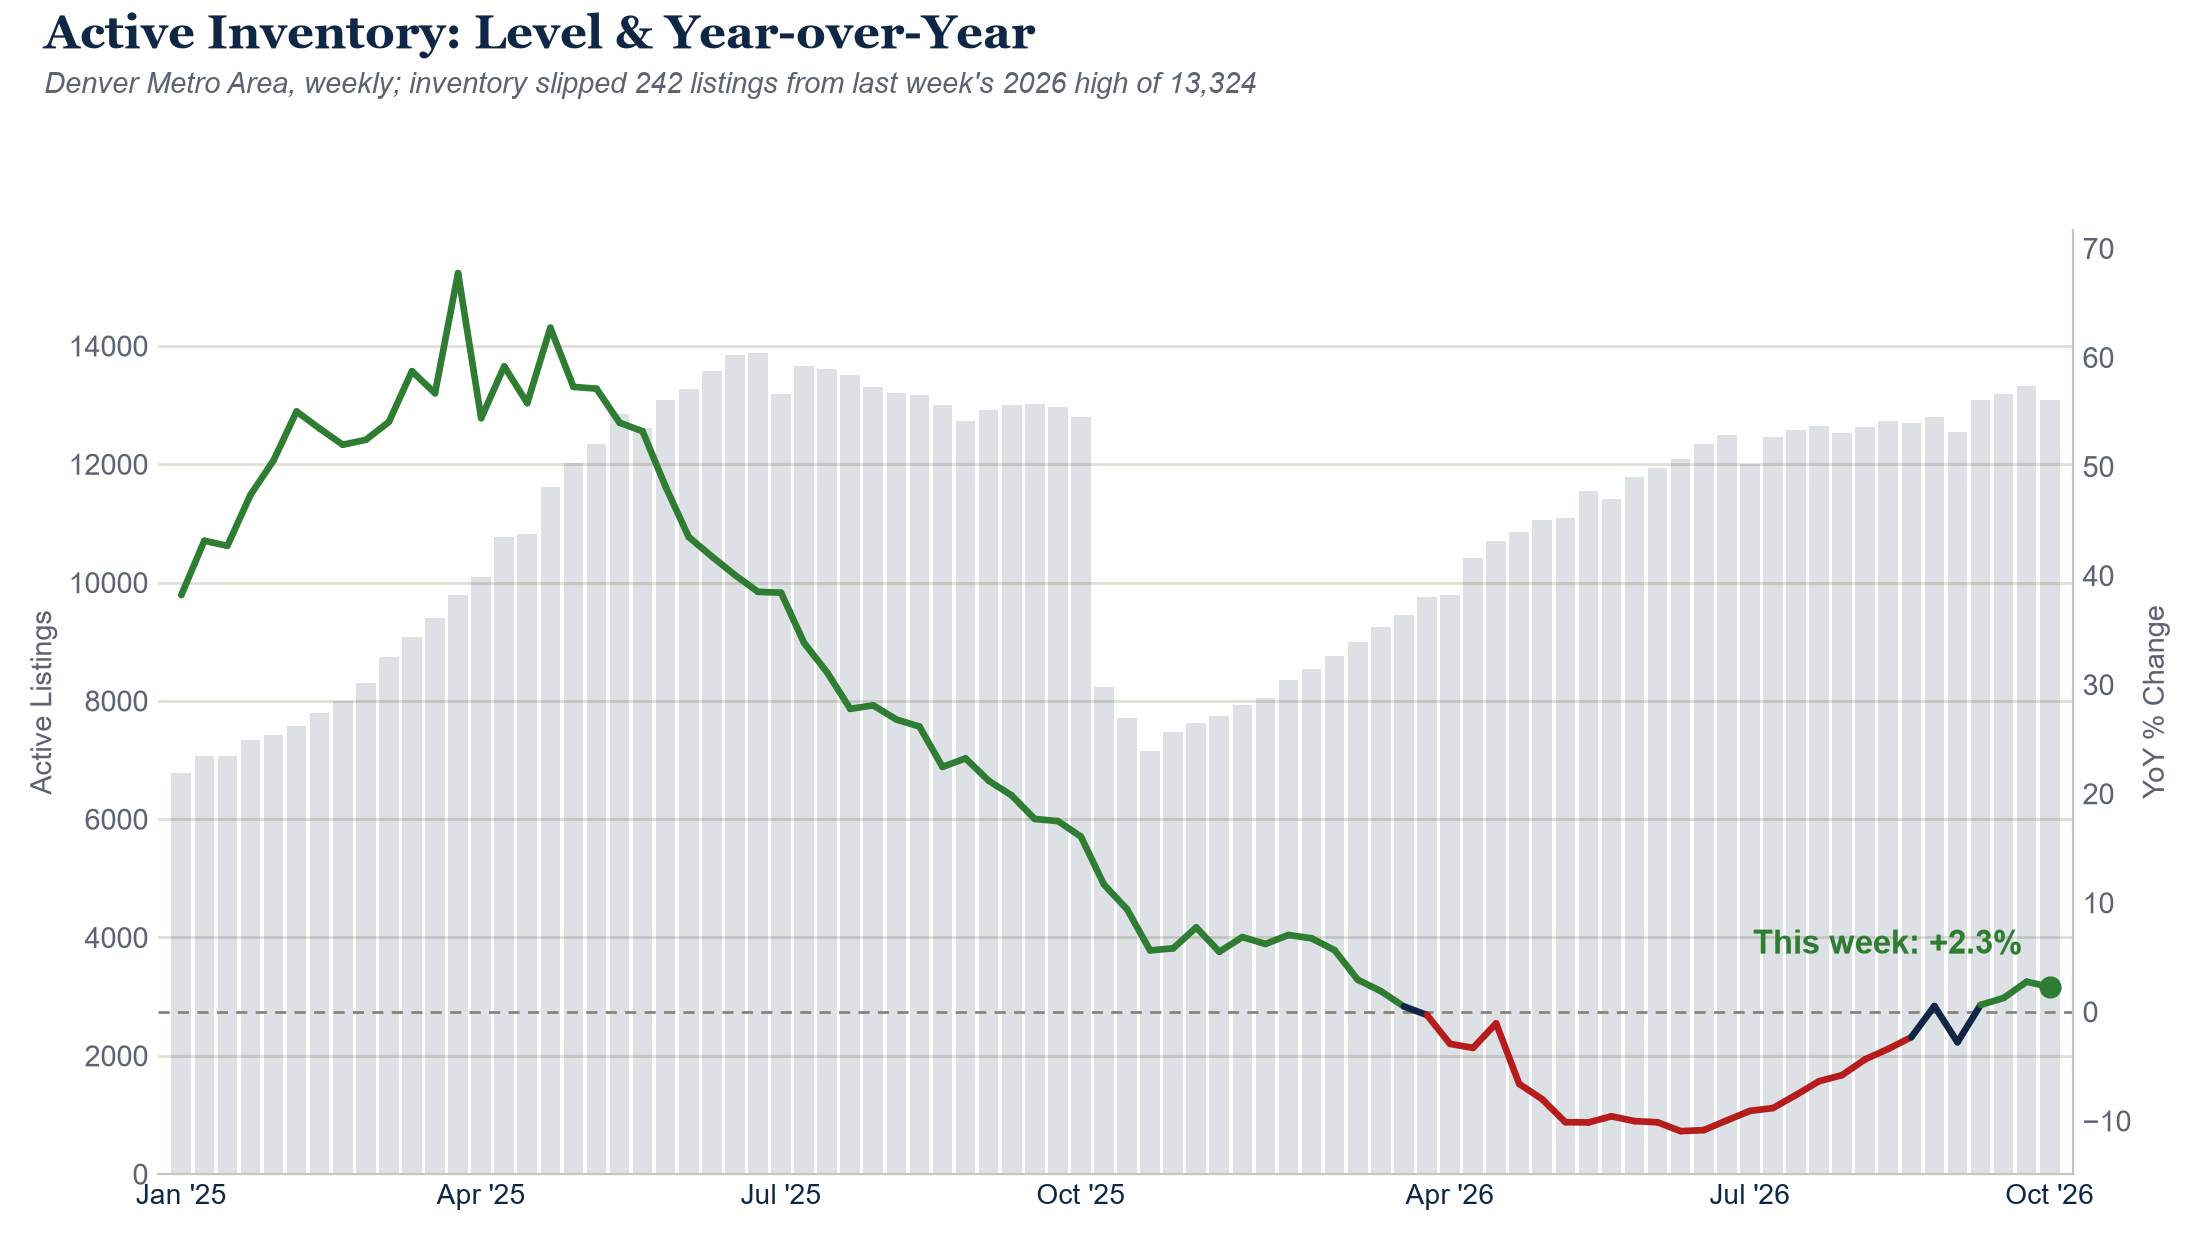
Active inventory slipped 242 listings to 13,082 after reaching a 2026 high of 13,324 last week, and its lead over last year narrowed from +2.8% to +2.3%. One week is not a trend, but it is worth watching: if inventory keeps drifting lower while new listings stay down, the supply side of the market will tighten at the same moment demand is thinning.
Closings: A Look at the Market Before the Worst of the Rate Climb
As the fourth quarter begins and activity seasonally slows, the closing data offers a useful reference point. A home that closes today was usually put under contract 30 to 45 days ago, so the closings through Sept 26 mostly reflect contracts signed in August, when rates were near 6.7% and the contract deficit was about 8%. In other words, this is how the market looked just before the rate climb and the drop-off in showings took hold. Here is how each property type is holding up over the last eight weeks compared with the same eight weeks last year.
| Property type | Closings | Typical close price | Median days on market | Net list-to-close ratio | Sales with concessions |
|---|---|---|---|---|---|
| Single-family | -13.8% | $640,500 (-0.2%) | 24.6 (-4.4 days) | 94.7% (+0.7 pt) | 62.8% (-1.9 pts) |
| Condo | -18.0% | $307,600 (-4.4%) | 50.1 (+1.4 days) | 92.0% (-0.1 pt) | 53.6% (-2.3 pts) |
| Townhome | -18.6% | $438,000 (-3.6%) | 39.1 (+3.6 days) | 93.3% (-0.9 pt) | 67.7% (+5.0 pts) |
| All property types | -14.8% | $582,600 (-0.6%) | 28.6 (-2.9 days) | 94.4% (+0.5 pt) | 62.3% (-1.2 pts) |
Eight weeks ending Sept 26 versus the same eight weeks last year, weighted by closings. Net list-to-close ratio is the final sales price after seller concessions as a share of list price.
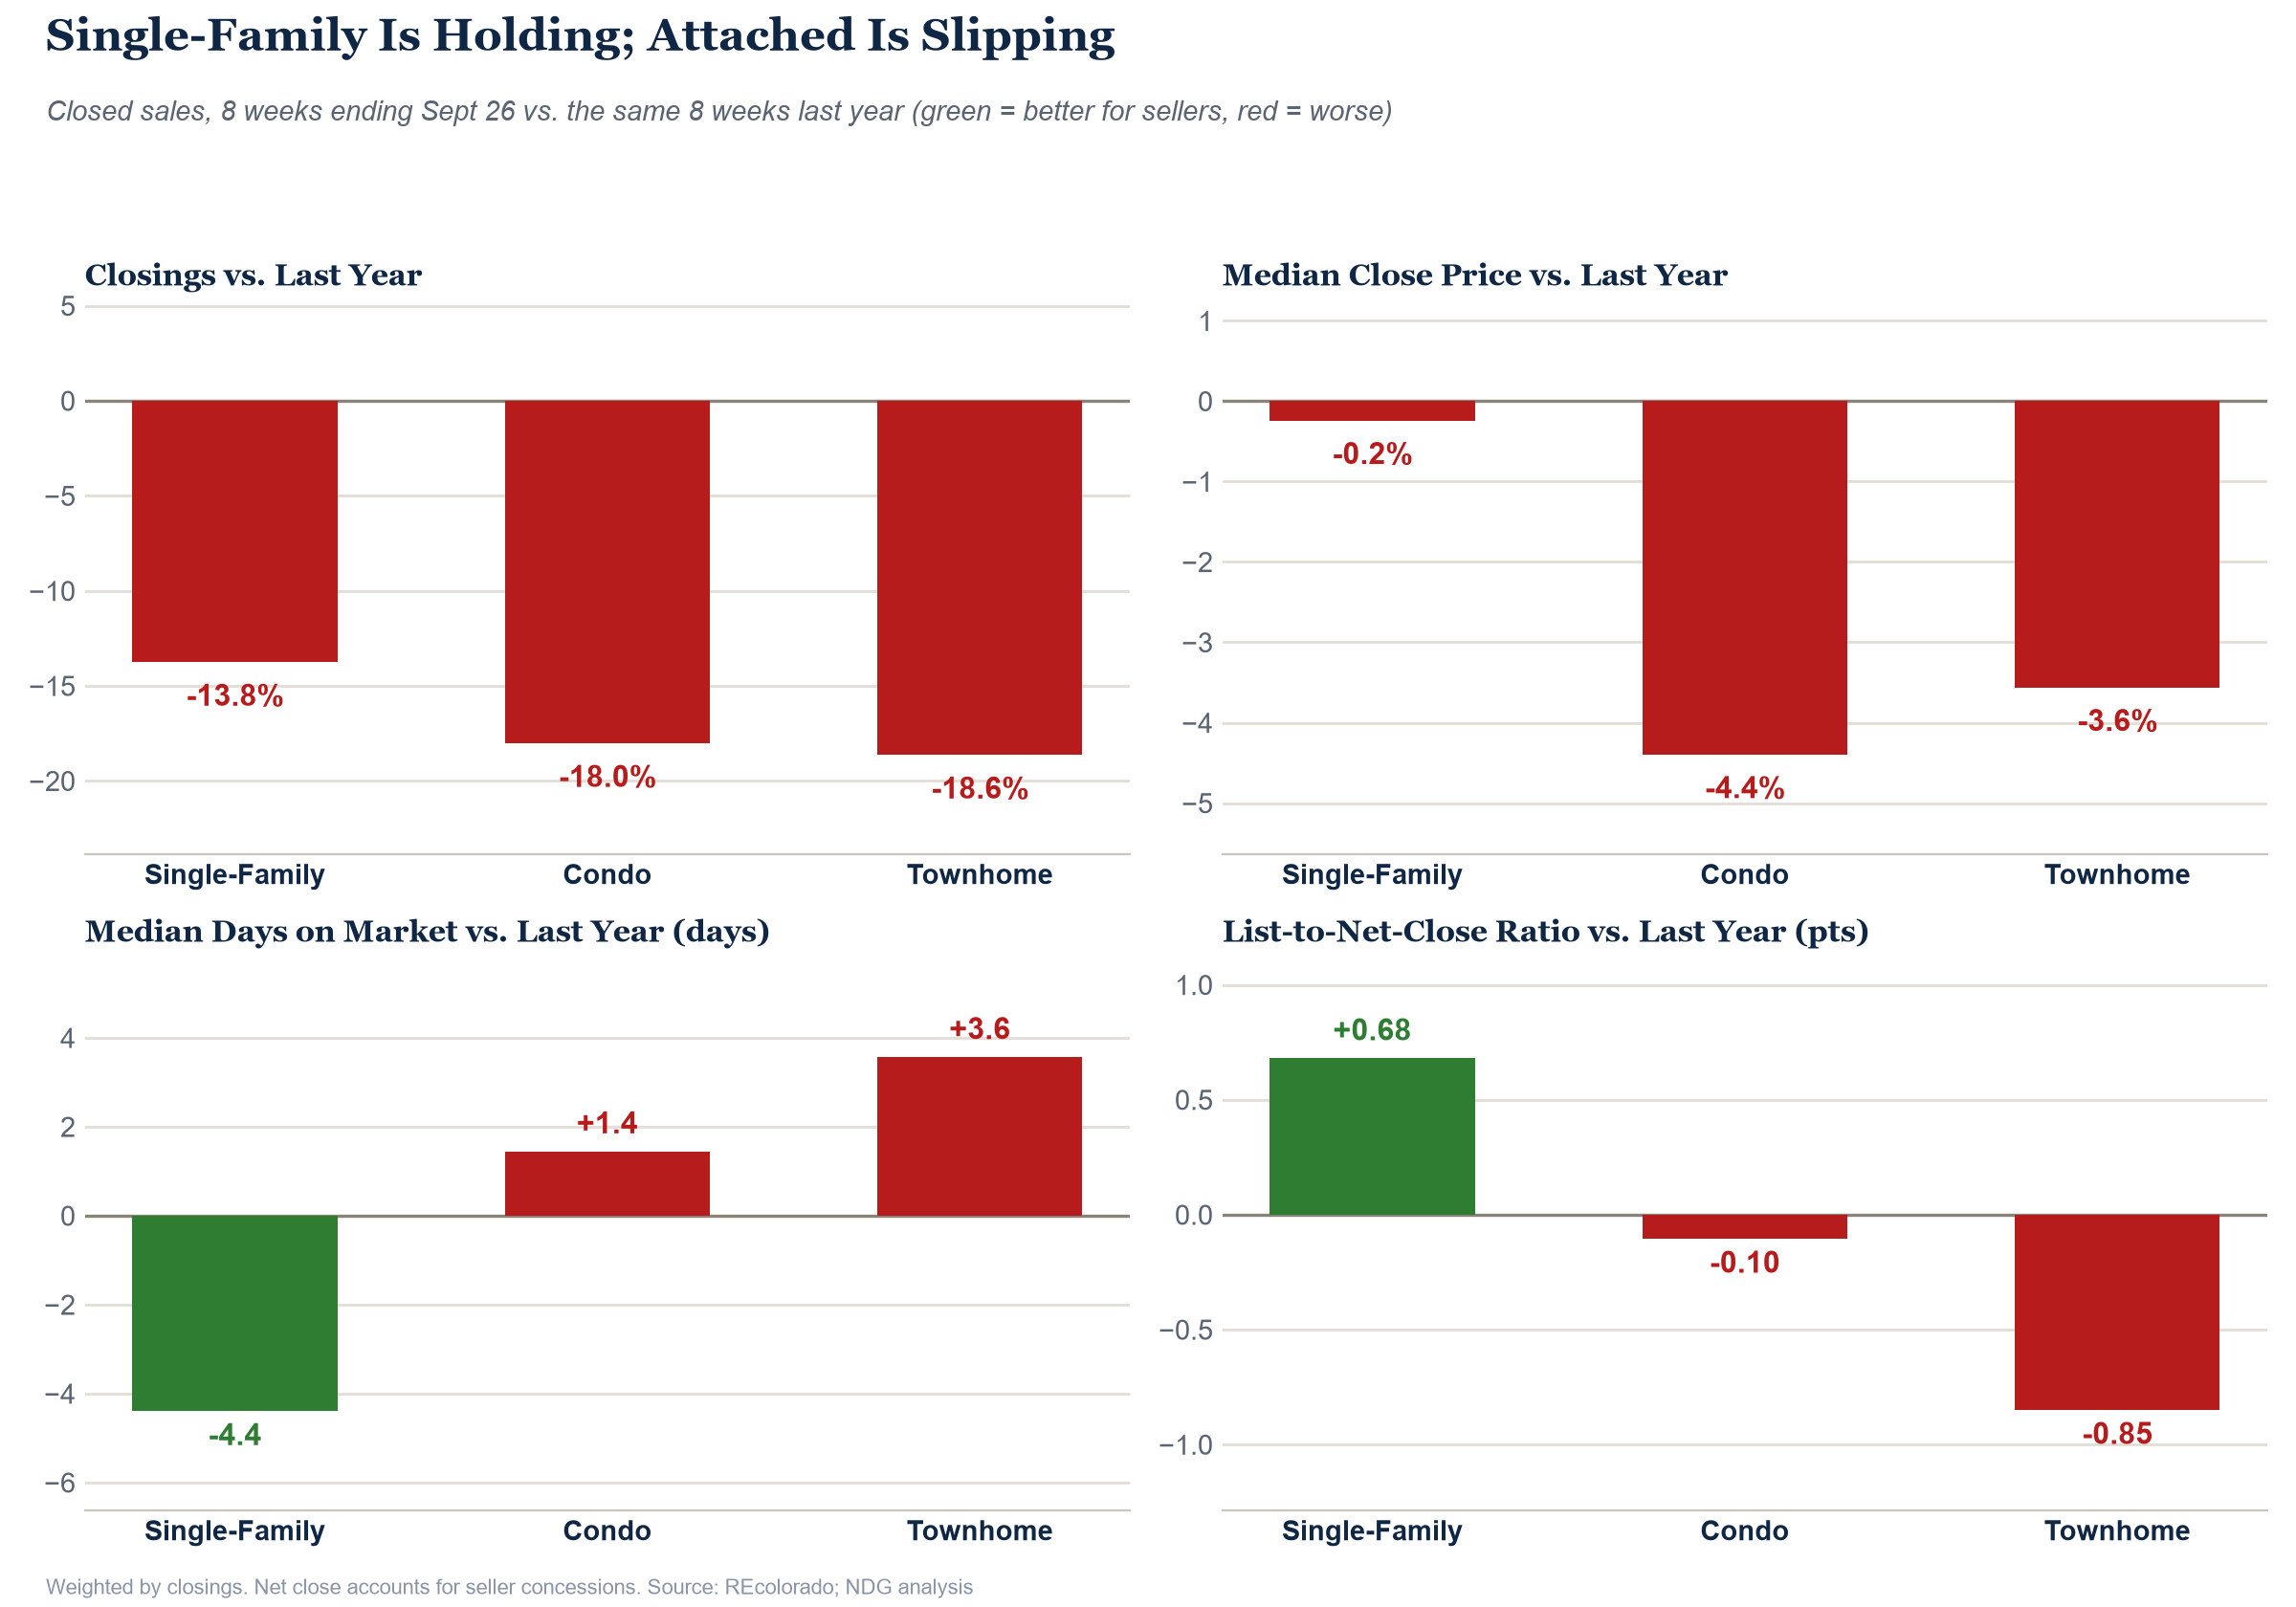
The split between property types is the story. Single-family volume is down nearly 14%, but the homes that did close held their prices, sold more than four days faster than a year ago, and netted sellers 94.7% of list price after concessions, up from 94.0%. Fewer single-family sales also involved concessions. Attached homes tell a different story: condo and townhome volume is down 18% to 19%, typical close prices are down 4%, homes are taking longer to sell, and townhome sellers are giving concessions on more sales (67.7%, up from 62.7%) while netting less of their list price (93.3%, down from 94.1%).
MSI Crosses 5.0 for the First Time This Year
Closed months of supply moved past a series of marks this week: above 4 for single-family for the first time this year, above 10 for condos, and above 5 for the market as a whole. A caution on the closed figure: it divides inventory by the last four weeks of closings, and that window still includes two thin weeks (539 closings over Labor Day and 606 last week), so it runs somewhat higher than the underlying pace. Pending MSI, which uses contracts rather than closings, stays below closed MSI for every property type, by about half a month overall, the widest gap since March. That tells us contracts are still being written a bit faster than closings suggest. It does not mean the market is warming: pending MSI has risen from 4.02 a month ago to 4.56, so supply is building relative to contract pace.
Reductions Are Tracking Last Year, With Attached Homes Edging Ahead
The share of listings with a price reduction continues to run very close to last year. Overall and for single-family homes it remains slightly lower, with both gaps narrowing again this week. Attached homes moved ahead of last year by 0.6 points, their largest lead since the week of July 4. The depth of the cuts has crept higher over the past five weeks, from about 6.0% of list price to 6.3% overall, but they remain modest. Attached cuts averaged a record 6.7%, and townhome cuts at 5.5% are the deepest we have tracked since we began following condos and townhomes separately. Condos, at 7.7%, are just off last week’s record of 7.8%.
The Big Picture: Thin Demand, Patient Sellers, and a Key Question for Q4
Every demand-side measure points the same way. Rates have risen for seven straight weeks, showings are 13 weeks behind last year and falling faster, and pending contracts are down about 12%, with attached homes down far more. The closing data shows what that early weakness looks like at the closing table: volume down nearly 15%, single-family prices holding, attached homes slipping, and the contracts written since mid-September are weaker than the ones behind today’s closings.
On the seller side, the stress has not arrived. Price reductions are tracking last year, expirations are only modestly higher (333 this week versus 313 a year ago), and many sellers are choosing not to list at all. That raises the question for the rest of the year: can fewer listings balance the scales for the sellers who remain? Single-family sellers are already getting some of that benefit, with prices holding and homes selling faster even as volume falls. But balance requires supply to fall at least as fast as demand, and for now demand is falling slightly faster, with showings down about 13% and new listings down about 10%. We will be watching inventory closely, since this week’s dip in listings could be the start of a trend or a one-week blip.
Call check, months of supply (graded: right): in late August we called for Total Closed MSI to keep climbing and test 5.0. At 5.07 it has cleared that mark. Part of the move reflects two thin closing weeks, so we will see how it holds once they roll out of the window.
Call check, pending resilience (graded: right): we called the brief narrowing in the pending deficit short-lived, since it was a Labor Day calendar mismatch rather than a real change in direction. The deficit is now about 12%, deeper than the 8% to 9% baseline we were measuring against.
Call check, pending deficit: graded when the showings deficit improves past -8% for two straight weeks or worsens past -15%. The as-reported deficit is -12.7%, and calendar-aligned readings have run around -14% to -15% for three weeks, right at the trigger. Still open, trending toward the call being right.
Call check, active inventory: inventory is still +2.3% year over year, so the call for it to stay positive through year-end remains on track, with this week’s dip the thing to watch.
Call check, mortgage rates: we called for rates not to close below 6.75% at any point through Dec 31. At 7.57%, they are 82 basis points above that floor. On track.
Call check, sellers giving ground: we called for reductions and expirations to move above last year’s pace. Total and single-family reduction shares remain slightly below last year, and attached homes are above. Still open, with the first month-end expirations check due next week.
New call: we expect closings to keep running at least 10% below last year through Thanksgiving. We will grade it on the 8-week total ending Nov 21 versus the same eight weeks last year, currently -14.8%: right if the deficit is 10% or worse, wrong if it narrows to less than 10%.