

Mortgage rates closed the week at a level not seen since spring 2024, and the demand side of the market is the one absorbing the impact. Showings and pending contracts are both down double digits from a year ago, and that trend has no obvious reason to reverse while rates keep climbing. Sellers, so far, are largely undisturbed: inventory is still growing, price reductions are still running behind last year’s pace, and nothing in the data points to real seller stress yet. That gap between a struggling demand side and a still-patient supply side is this week’s real story. That continues the thread from last week’s update.
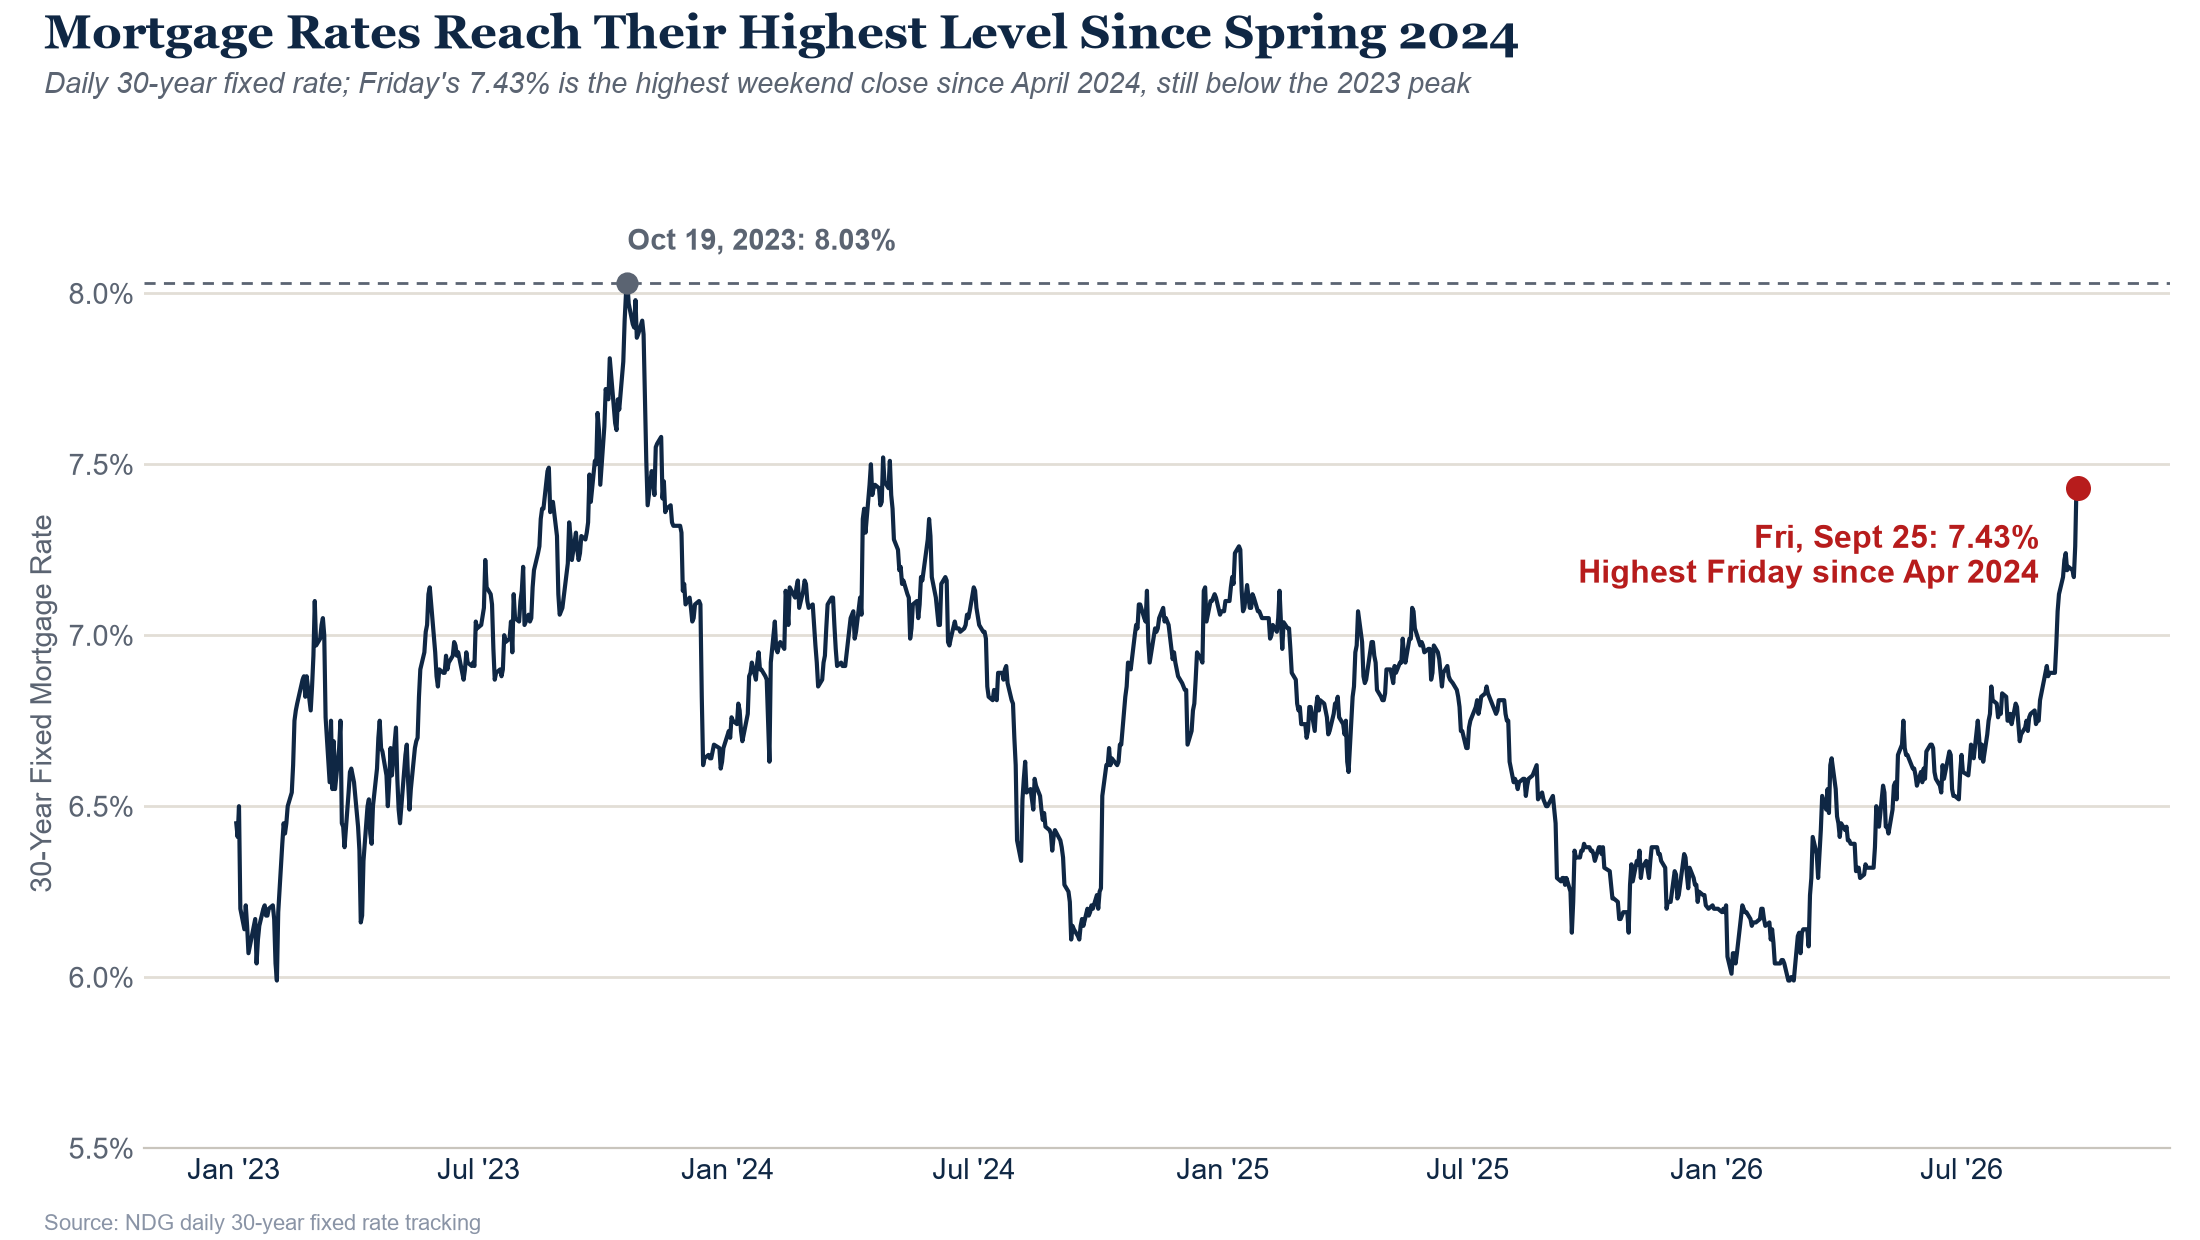
7.43%: The Highest Friday Close Since April 2024
11,882 Showings: Down Double Digits Again
This is the fourth straight month showings have run behind the prior year, and with rates now above 7.4%, there is no reason to expect that to change soon. A calendar-aligned comparison, matched to the same point relative to Labor Day rather than a straight 364-day lookback, puts the deficit closer to 15%, suggesting the as-reported number may understate how much tour activity has actually slowed. Either way, the direction is the same: buyers are pulling back exactly as rates make ownership more expensive.
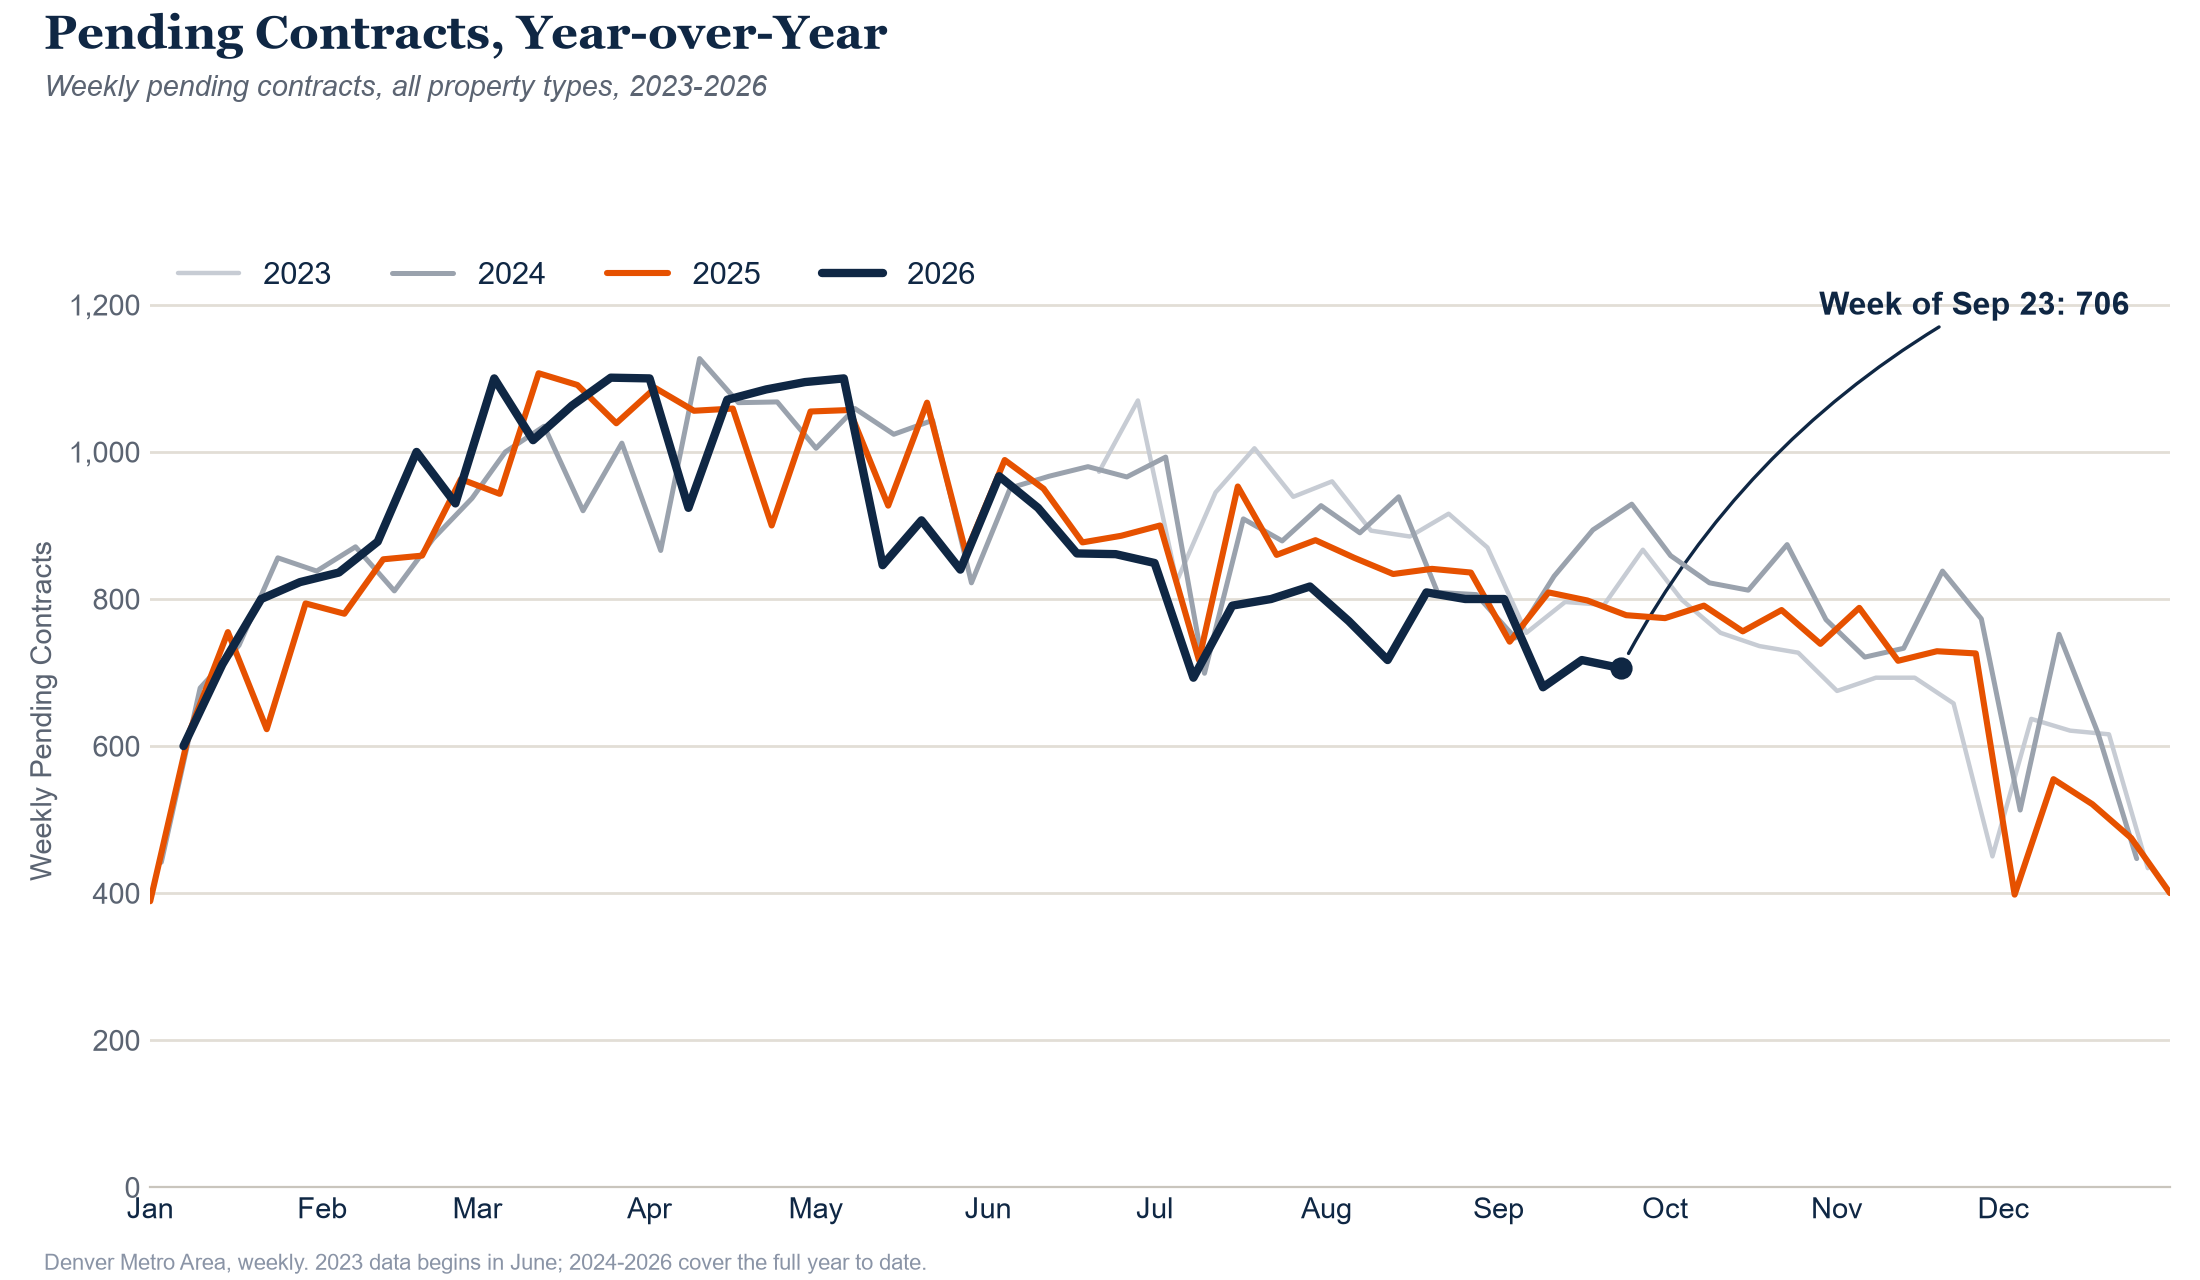
706 New Contracts: The Deficit Persists
Worth being precise about what happened two weeks ago, since it is easy to misread. Pending contracts never turned positive. The raw +7.8% reading for the week of Sept 2 was a Labor Day calendar artifact, that week’s normal pace measured against last year’s holiday-suppressed week, mirrored the following week by an artificially deep -15.9%, this year’s actual holiday week measured against a normal week last year. Corrected for the calendar and combined, that two-week stretch still came in negative, at -6.2%, simply a narrower deficit than the -8.6% eight-week baseline running at the time. That narrower gap did not hold. The last two weeks (-10.2%, -9.3%) have put pendings right back at that same baseline, which lines up with showings leading pendings by a week or two, and with the rate spike that began in mid-September. With rates still climbing, the more likely path from here is a deeper deficit, not a return to that brief narrowing.
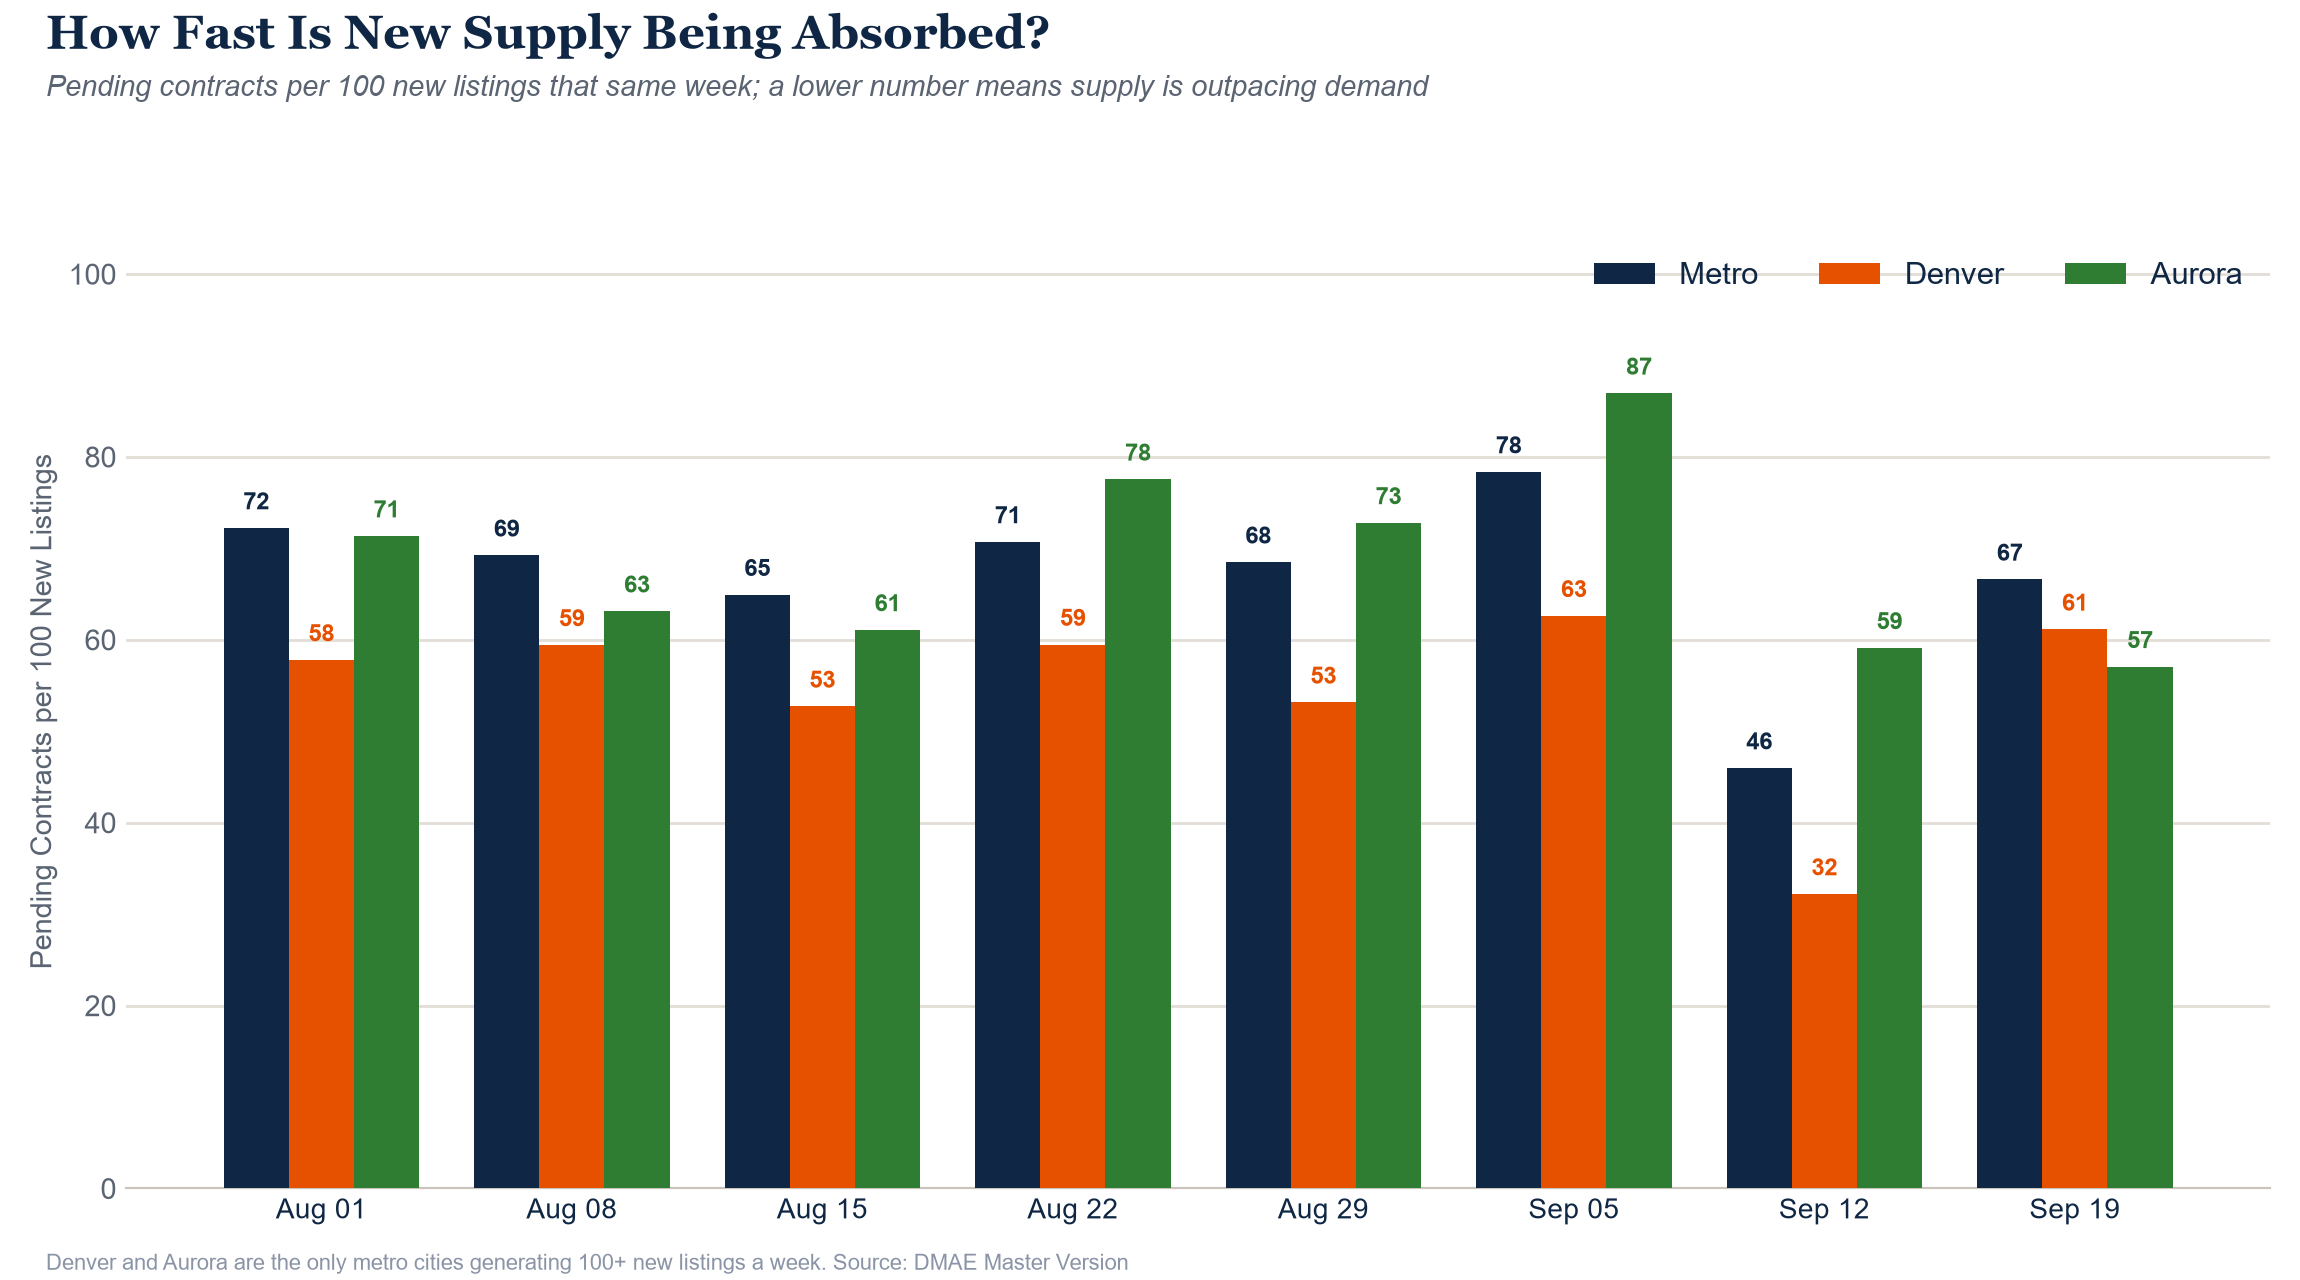
67 Pending per 100 New Listings, Metro-Wide
58.2% of Active Listings Have Reduced, Gap to Last Year Narrows Slightly
Both the Total and SFR gaps to last year narrowed slightly this week (Total from -0.5 to -0.5 points, essentially flat; SFR from -1.1 to -0.9 points), continuing a slow, uneven convergence toward last year’s pace rather than a sharp move. Attached is the one segment still running ahead of last year, and even there the gap edged in, from +0.5 to +0.4 points. Two cities crossed a threshold worth noting: Aurora (60.3%) and Broomfield (60.8%) both cleared 60% of active listings with a reduction for the first time in 2026.
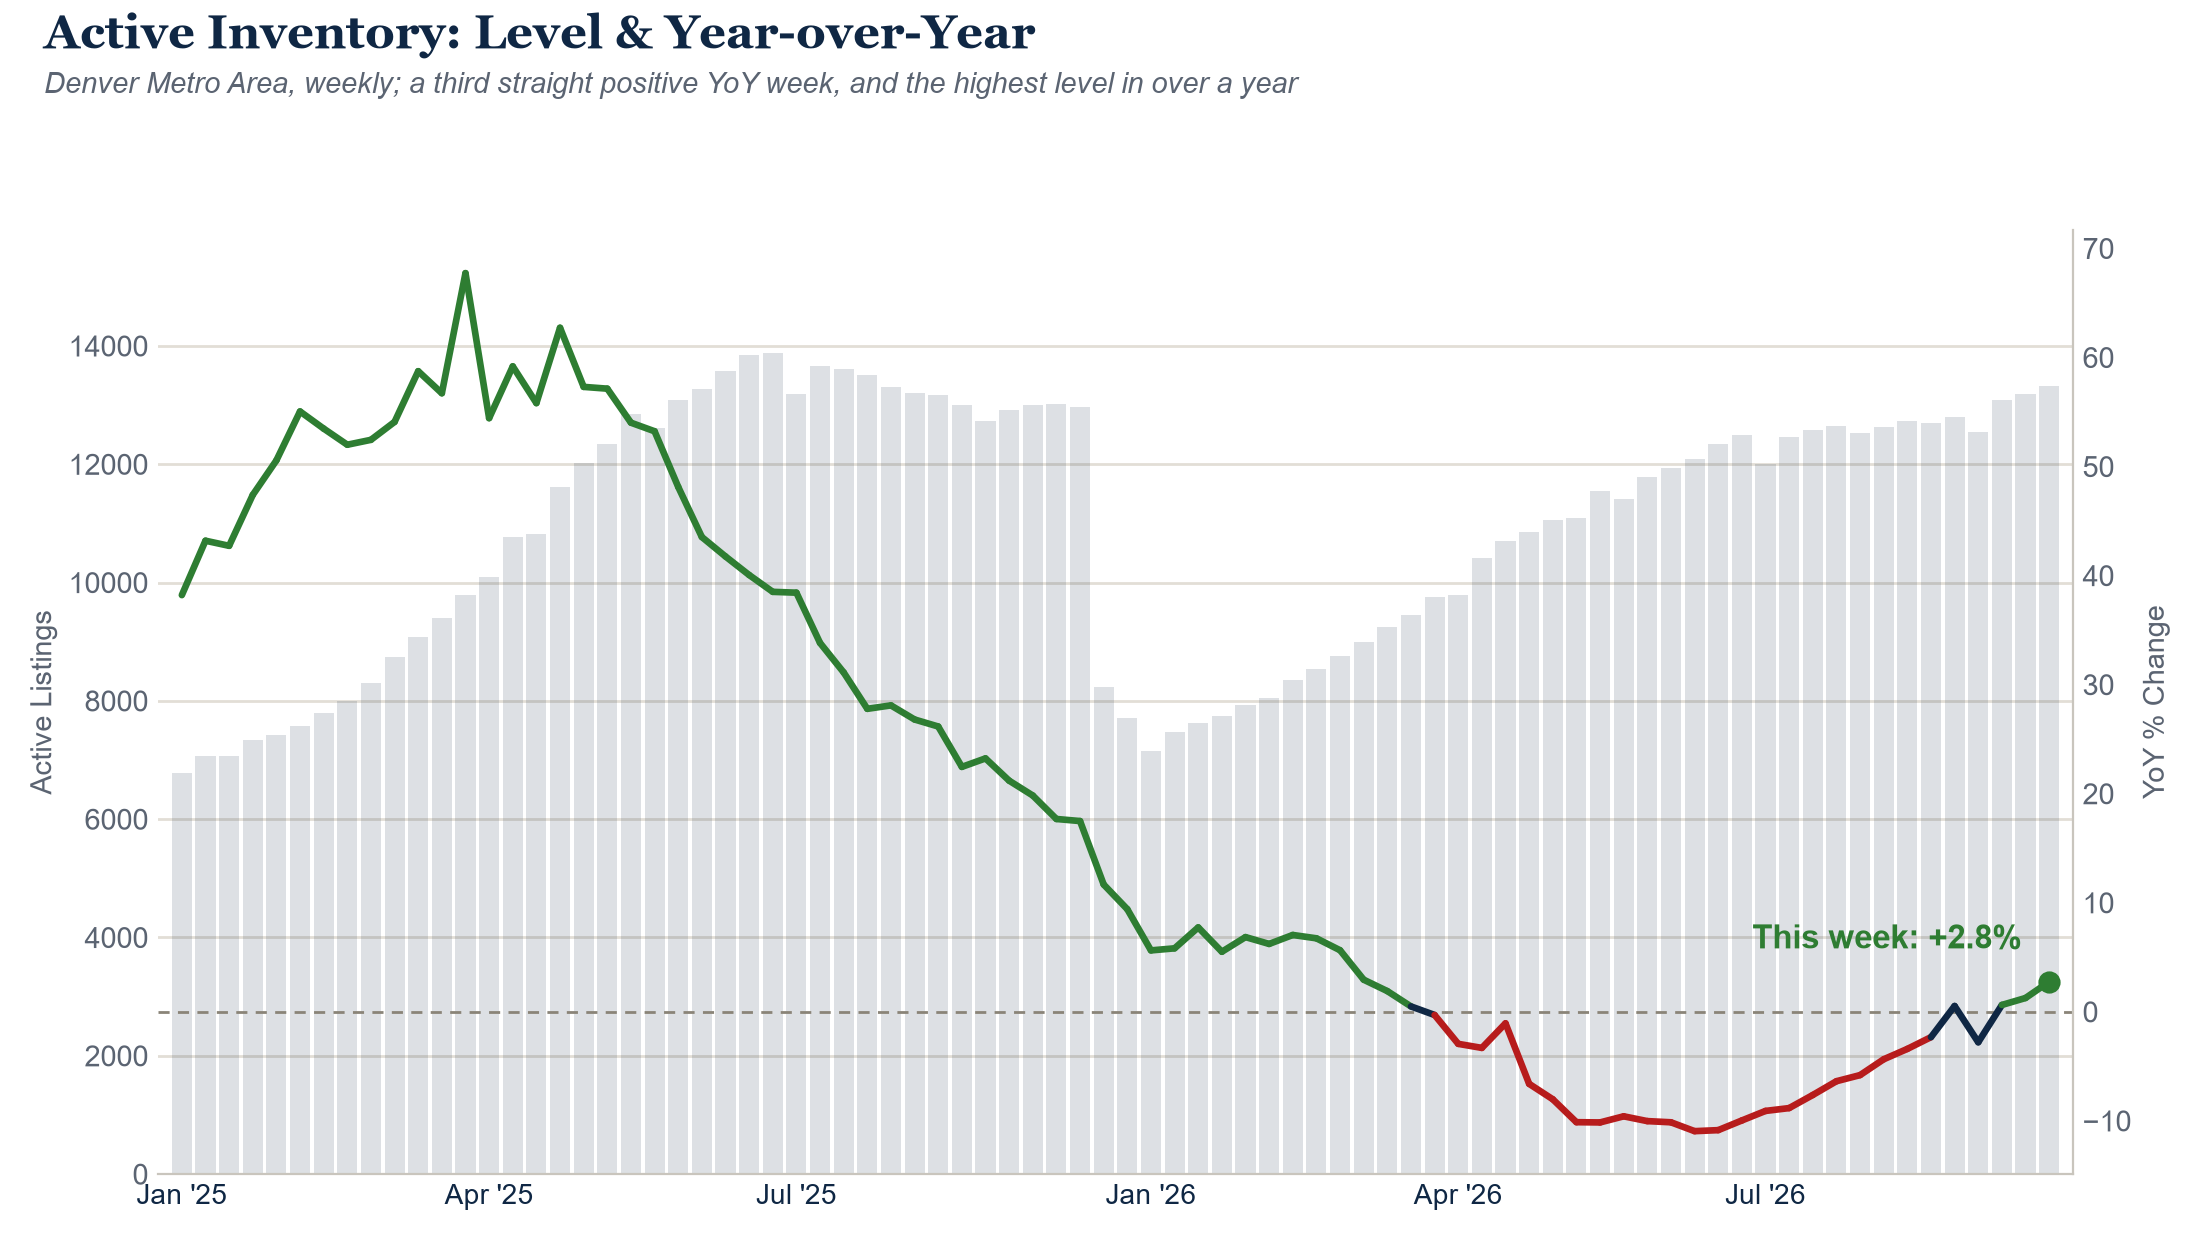
13,324 Active Listings: A Third Straight Positive Week
1,156 New Listings, 702 Closings, 4.74 Months of Supply
New listings for the week ending Sept 19 came in at 1,156, down 9.6% from a year ago. Closings that same week totaled 702, at a median price of $575,000 and a median 33 days on market, up from 31 the week before. Months of Supply held at 4.74, its highest reading of the year and just short of the 5.0 threshold in our active Call. Expired listings ticked up to 371, still running about 14% above last year, consistent with a market that is slowing but not yet showing acute stress on the seller side.
The Big Picture: Demand Is Cracking, Supply Isn’t Yet Under Stress
Every demand-side number in this update points the same direction. Rates closed the week at their highest level since spring 2024, after one of the larger weekly jumps of the past year and a half. Showings are down double digits from a year ago for a second straight week. Pending contracts have missed last year’s pace all year. The brief narrowing we noted two weeks ago was never a real turnaround, just a mismatch between when Labor Day fell last year versus this year, and once that mismatch cleared, the deficit was right back where it had been running for months. None of that is surprising given where rates sit, and none of it looks likely to reverse while rates keep climbing.
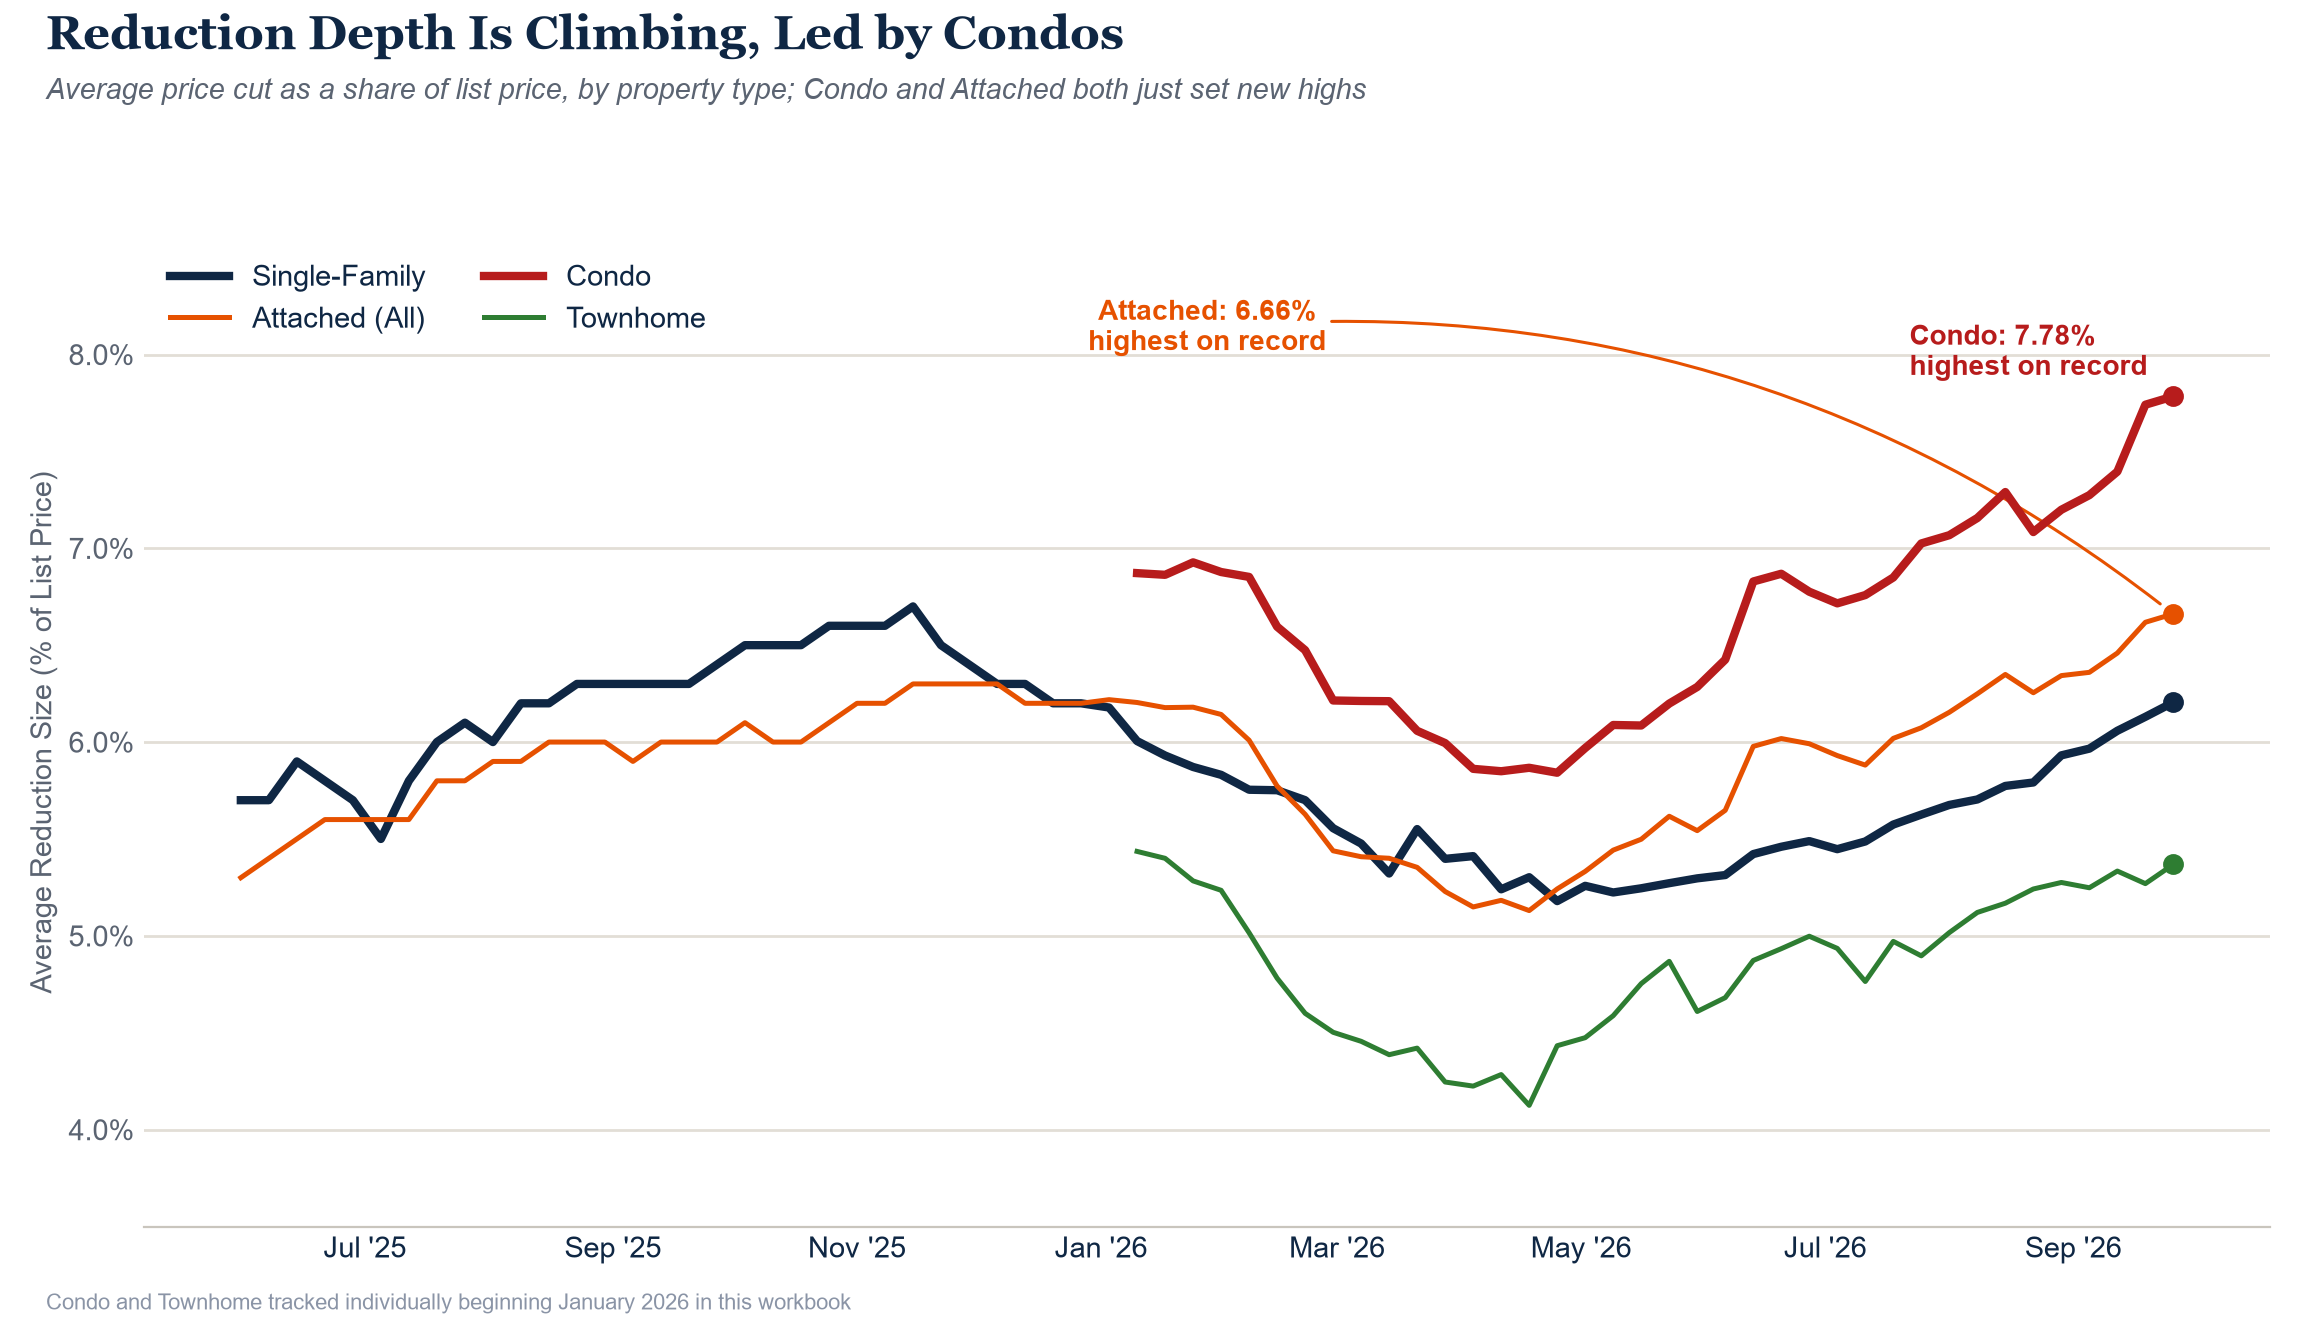
What is notable is what has not happened on the seller side. Inventory is building at its strongest sustained pace in over a year. Price reductions, while deepening in size, are still not more common than they were last year. Expirations are elevated but not sharply so. Sellers are, for now, absorbing a slower market without a broad shift toward panic pricing. That gap, between clear demand-side stress and a supply side that has not yet reacted, is the thing worth watching most closely from here. If rates hold near 7.5% for another month or two, we would expect that gap to start closing, with reduction frequency and expirations both moving further above last year. National data backs up what we are seeing locally: mortgage applications from homebuyers are down 19% from a year ago as rates surged, with refinance activity down even more sharply, the same demand-side retreat this update is tracking at the local level.
Call check, pending deficit: we called for the pending deficit to persist, graded when Showings’ year-over-year gap either improves past -8% for two straight weeks or worsens past -15%. This week’s calendar-aligned Showings reading is close to -15%. Still open, but trending toward the call being right.
Call check, months of supply: MSI reached 4.74 this week, its highest reading of the year and closer than ever to the 5.0 threshold, though not there yet. Still open.
Call check, active inventory: now three consecutive clean positive YoY weeks and the highest level since July 2025. Tracking right, graded at year-end.
Call check, pending resilience: we called the brief narrowing in the pending deficit short-lived, since it was a Labor Day calendar mismatch rather than a real change in direction, and said it would revert to the -8% to -9% baseline within 4-6 weeks. This week’s reading (-9.3%) is already back at that baseline. Leaning toward the call being right, though we will let the full window play out.