

Last week we told you active inventory had crossed into positive year-over-year territory for the first time since March, and this week’s headline number shows it back in a deficit. Don’t read too much into either move. Labor Day fell 6 days later this year than last, which throws off a straight week-over-a-year-ago comparison right at this exact point on the calendar, and when we correct for it, inventory’s deficit has actually been narrowing steadily and without interruption since July, sitting right at the edge of a genuine crossing rather than bouncing around one. Pending contracts hit the same calendar quirk from the other direction this week, breaking a 16-week losing streak on a reading that’s almost certainly borrowed strength, not a real turn. Showings, which don’t face this particular distortion, remain the clean read: still deep in their own 8-week deficit. That continues the thread from last week’s update.
12,547 Active Listings: A Steady Trend, Blurred by a Calendar Quirk
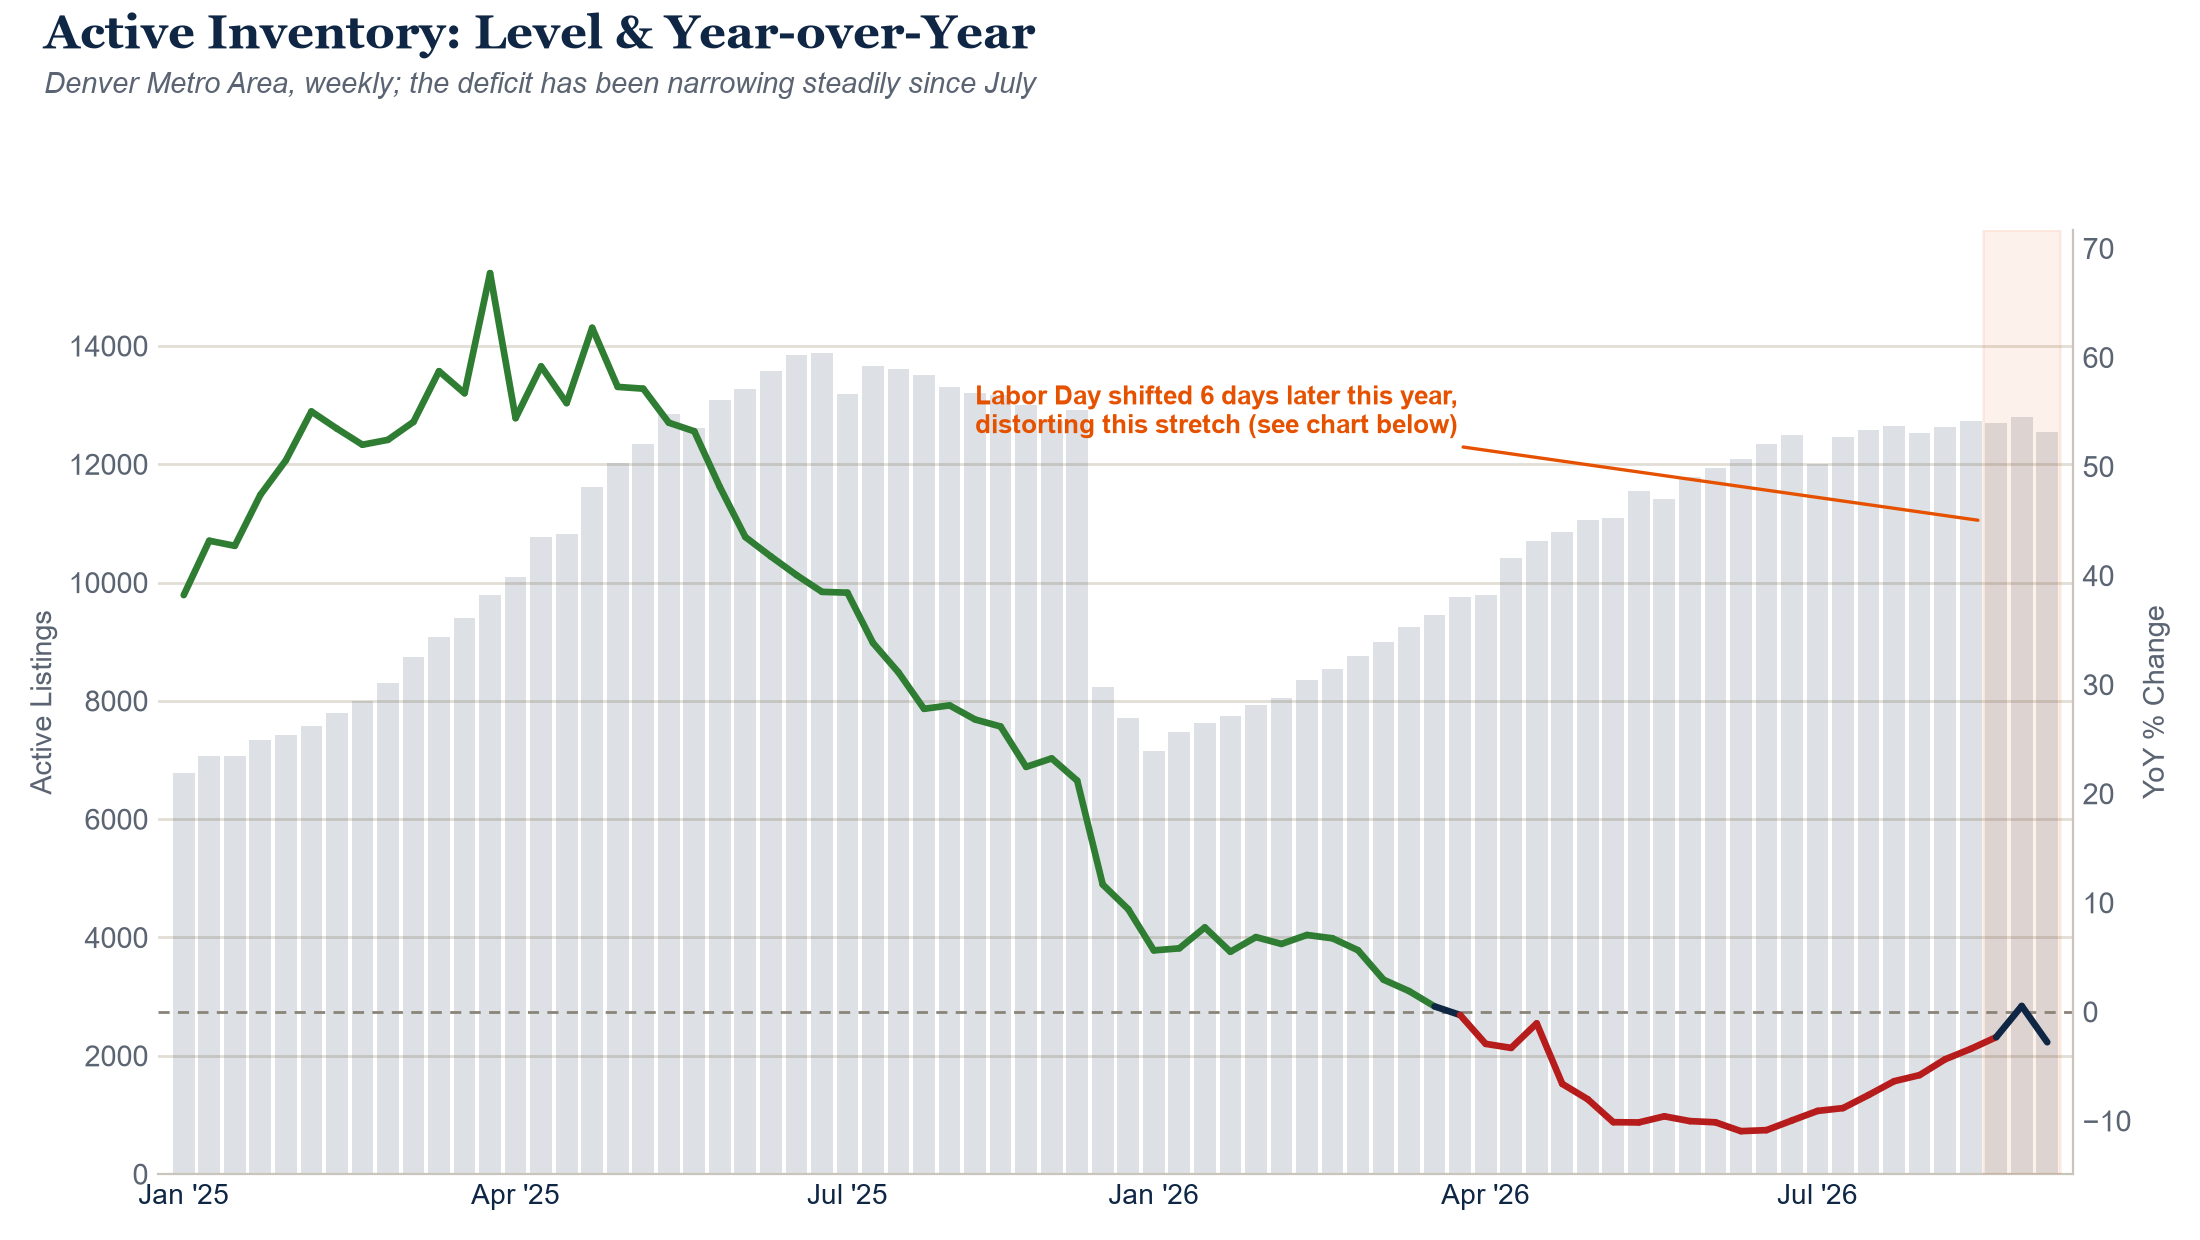
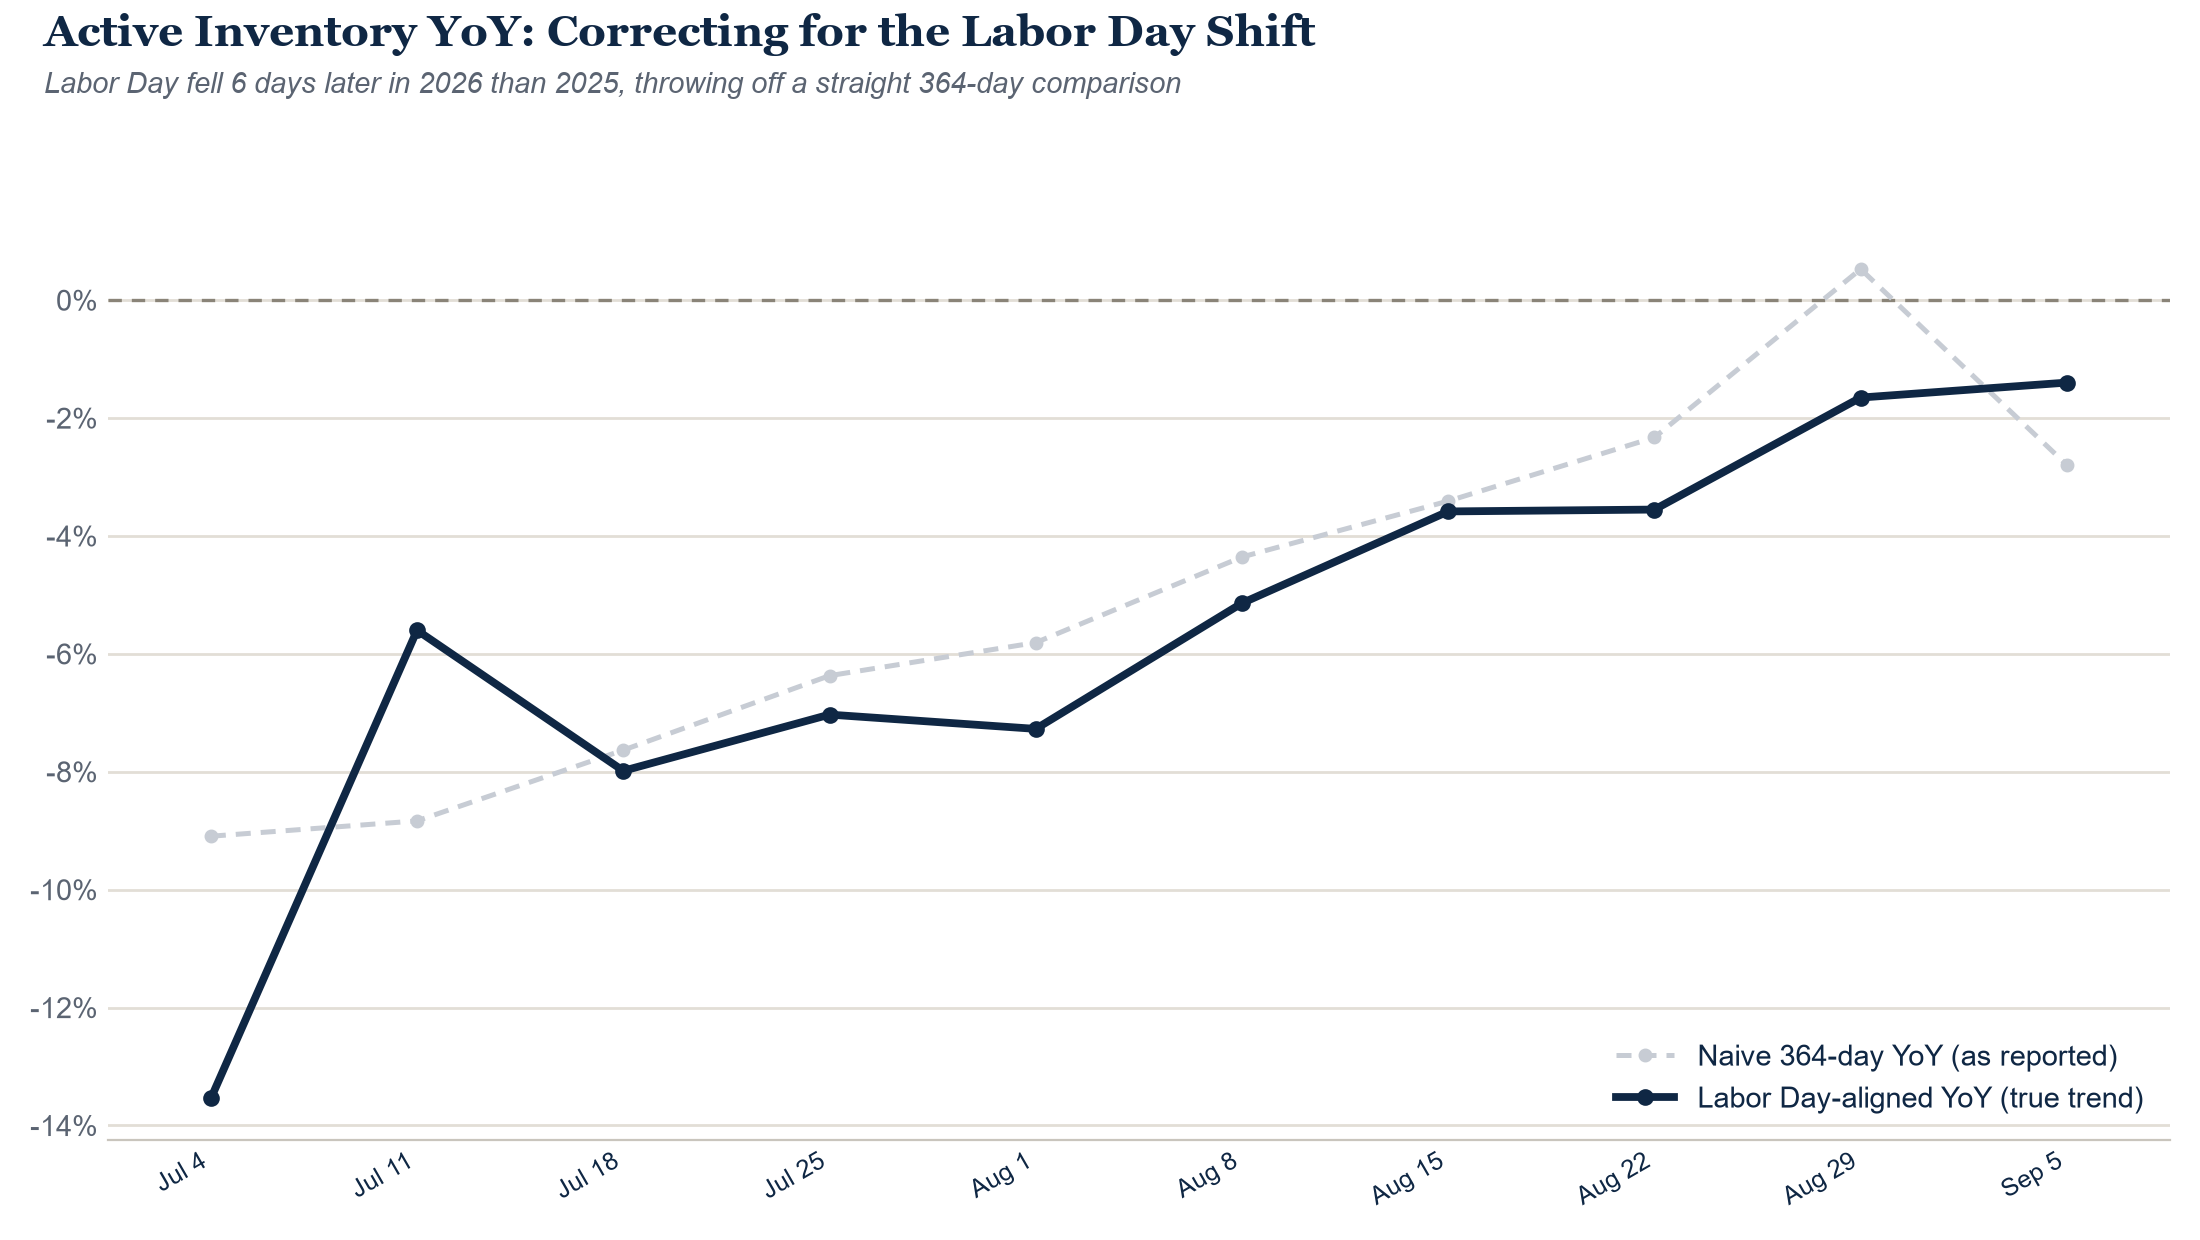
The metro number also isn’t uniform: this week Highlands Ranch (-41%) and Centennial (-30%) remain deep in deficit, while Englewood (+30%), Parker (+19%), and Westminster (+14%) are running well above last year, a wide spread hiding underneath that single metro-wide number. Given Showings remain deep in an 8-week deficit, meaning fewer homes are converting out of active status via pending contracts, the pressure that’s been narrowing this gap since July hasn’t let up. We’d expect a genuine crossing to positive within the next week or two once the calendar noise clears, and for it to hold from there. See the new call below.
800 New Contracts: Record 16-Week Streak Ends, but the Calendar Explains It
13,229 Showings (Preliminary): Demand Pressure Gap Still Negative
1,136 New Listings
A quiet week for new supply, in line with the seasonal slowdown heading into Labor Day. Nothing here changes the picture above: this week’s inventory story is about existing listings and the holiday calendar, not a surge of new ones.
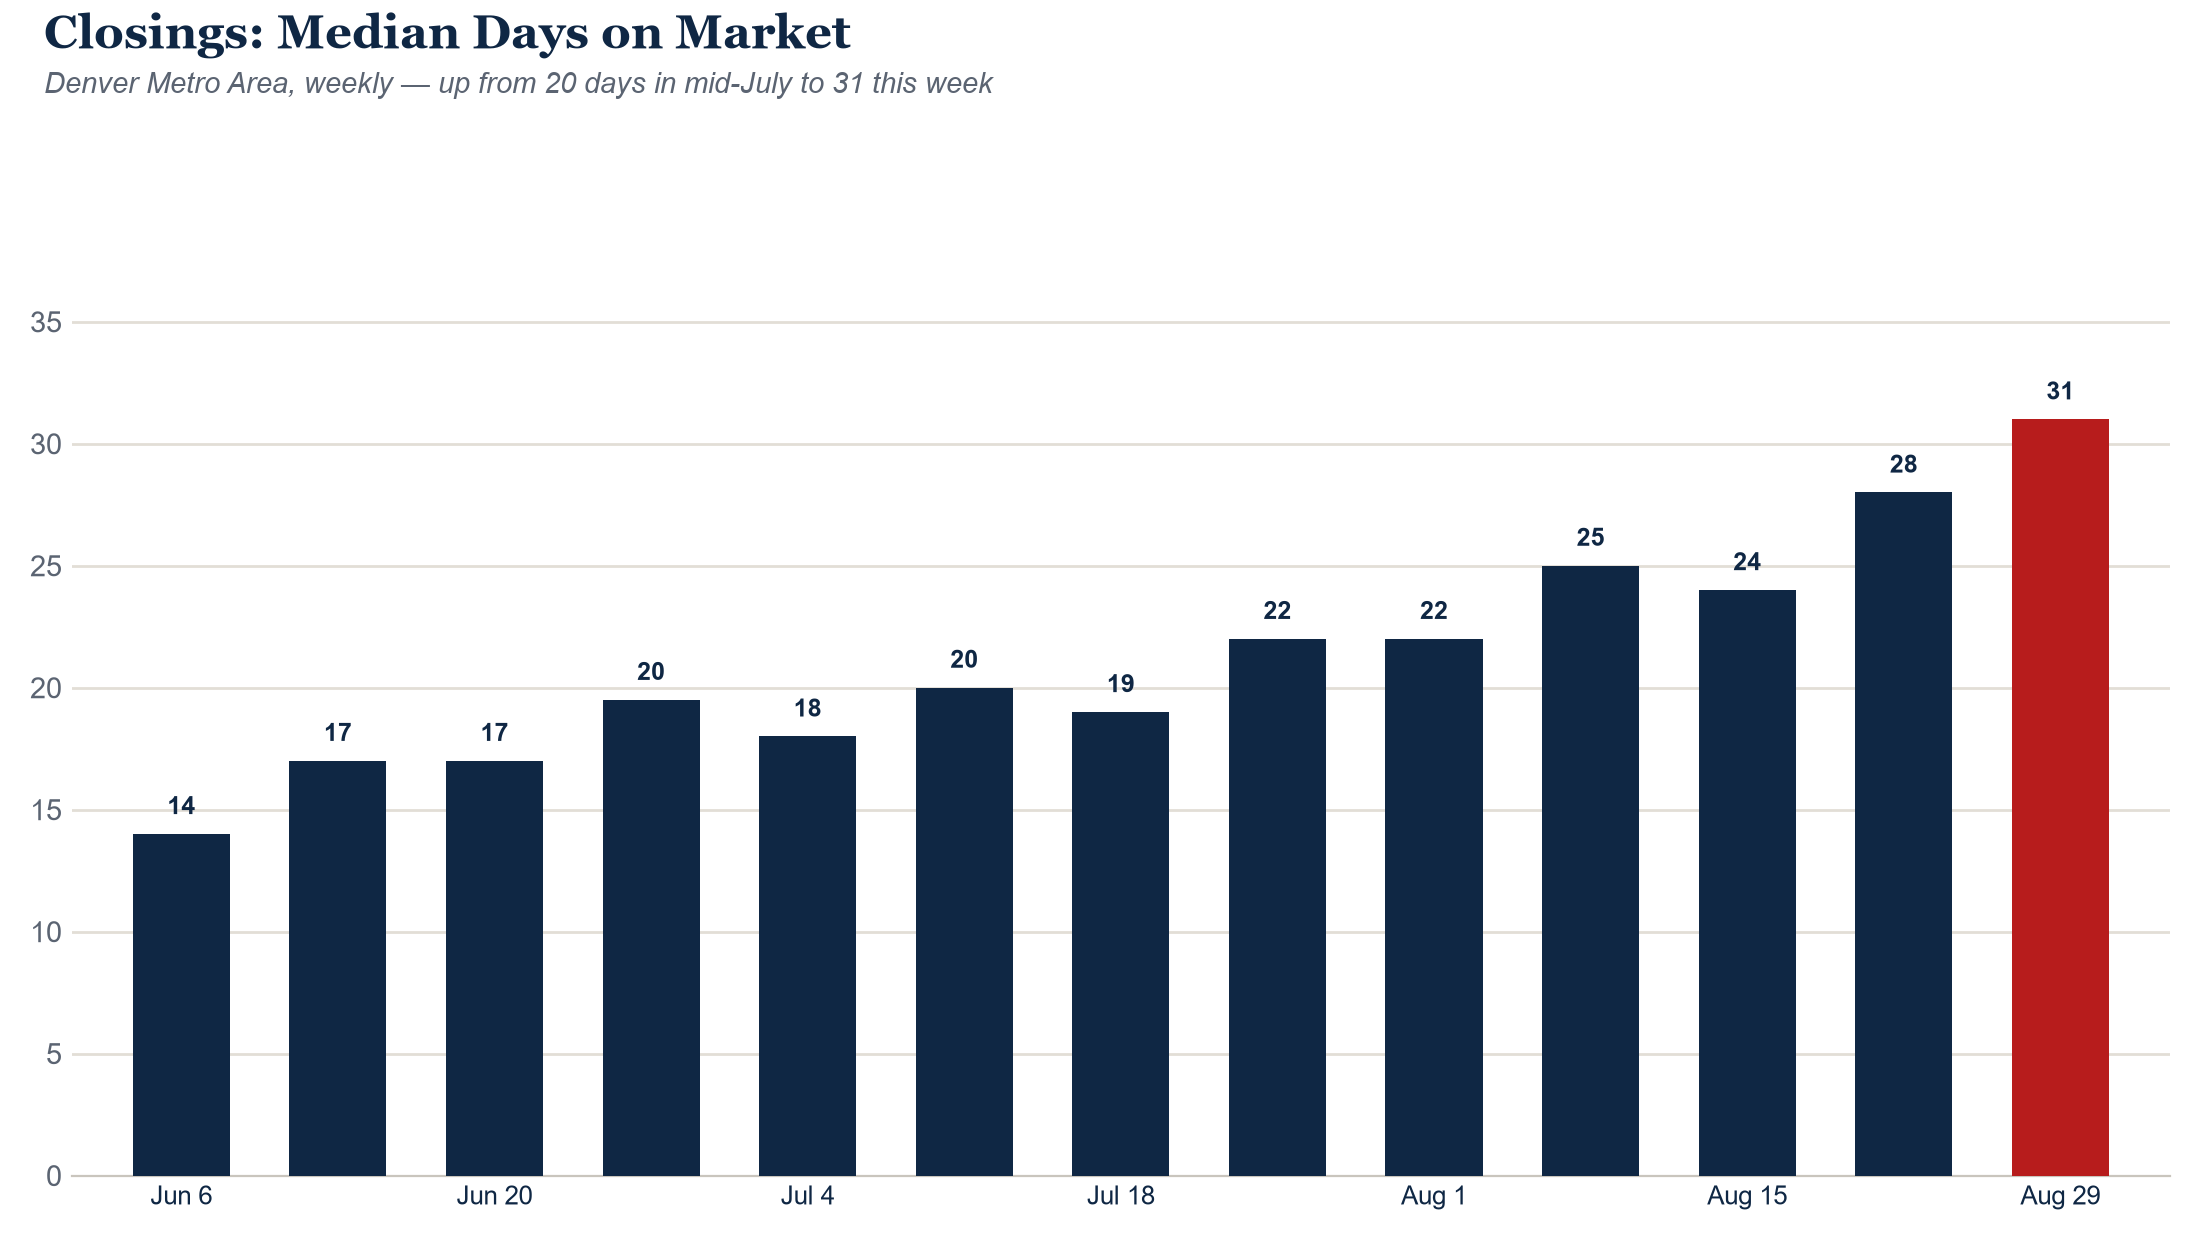
755 Closings: Volume Up, Still Down From Last Year, Taking Longer to Close
| SFR | Condo | Townhome | |
|---|---|---|---|
| Median closed price | $660,000 | $309,500 | $443,990 |
| Median days on market | 26.5 | 54 | 31 |
| List-to-close ratio | 95.8% | 91.1% | 95.2% |
| Concession rate | 61.4% | 52.4% | 66.7% |
| Median concession | 1.8% | 2.4% | 2.5% |
| Net ratio (after concessions) | 94.9% | 90.1% | 93.7% |
57.4% of Active Listings Have Reduced: Another New High
Two things are true at once here, and they tell different stories. The share of listings carrying a reduction keeps climbing to fresh 2026 highs (57.4% this week), and the median reduction (what a typical home actually gets cut) has held steady at $25,000 (about 4.4%) for months. But the average reduction size has jumped sharply, from around $42,000 to nearly $57,000 over the past two weeks. When the average moves that much more than the median, it’s almost always a handful of larger, likely higher-priced listings taking outsized cuts, not a broad shift in how much the typical seller is giving up. Worth watching whether that average keeps climbing (more big cuts joining in) or snaps back (it was a short-lived cluster).
4.47: Still Climbing
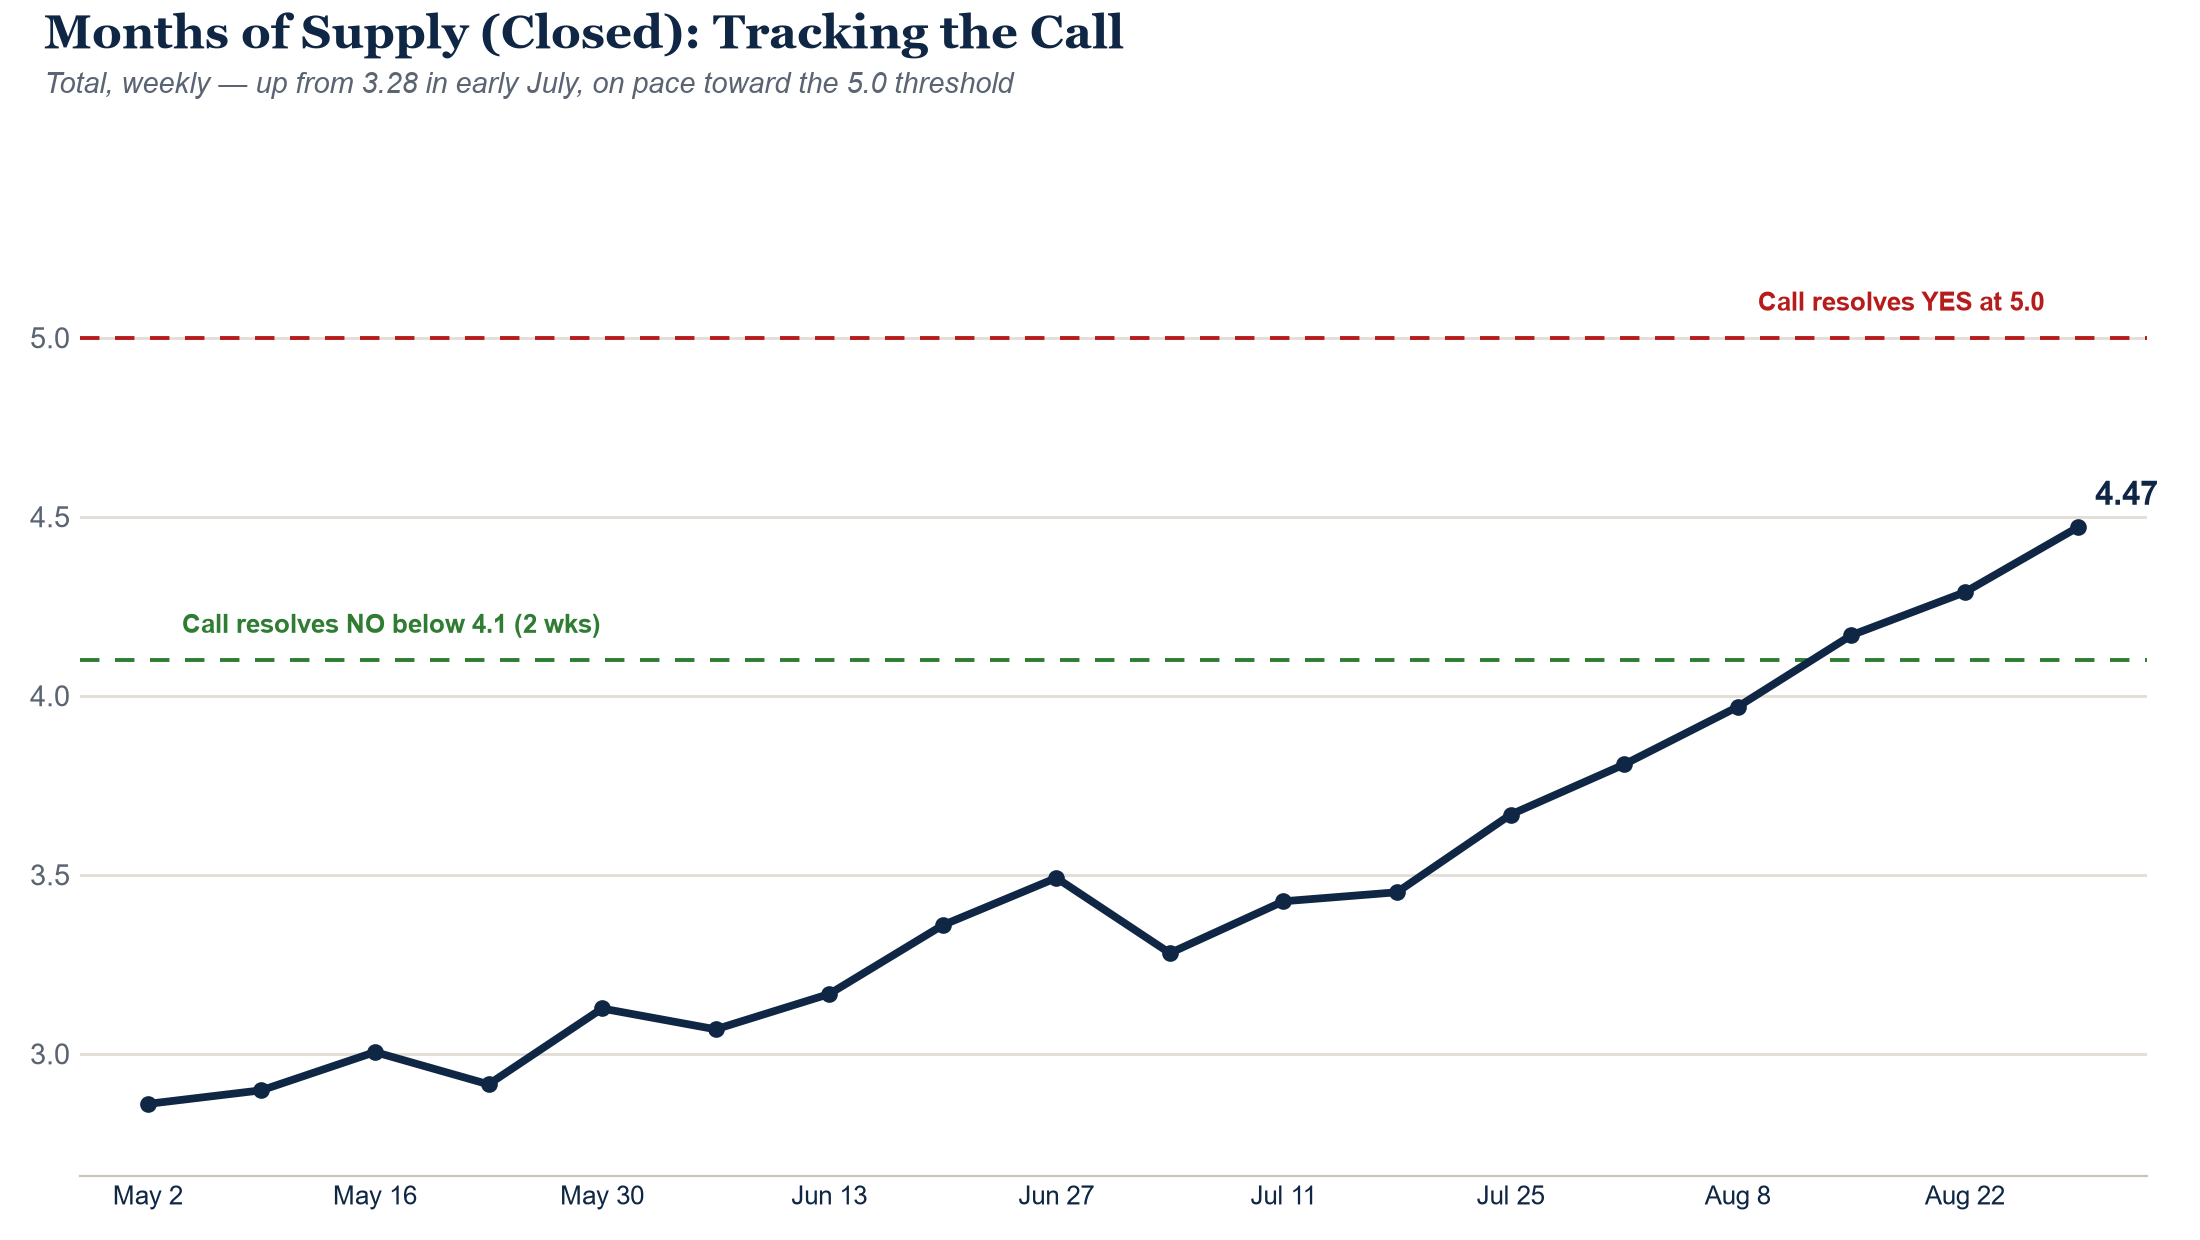
This is the mechanical result of everything above: closings running below last year’s pace and taking longer to happen, while pending contracts and showings stay near record-weak. That combination pushes months of supply higher every week it persists, and unlike last week’s inventory reading, this climb isn’t a seasonal artifact. It’s been running for eight straight weeks, up from 3.28 in early July.
A Wide Spread Underneath the Metro Number
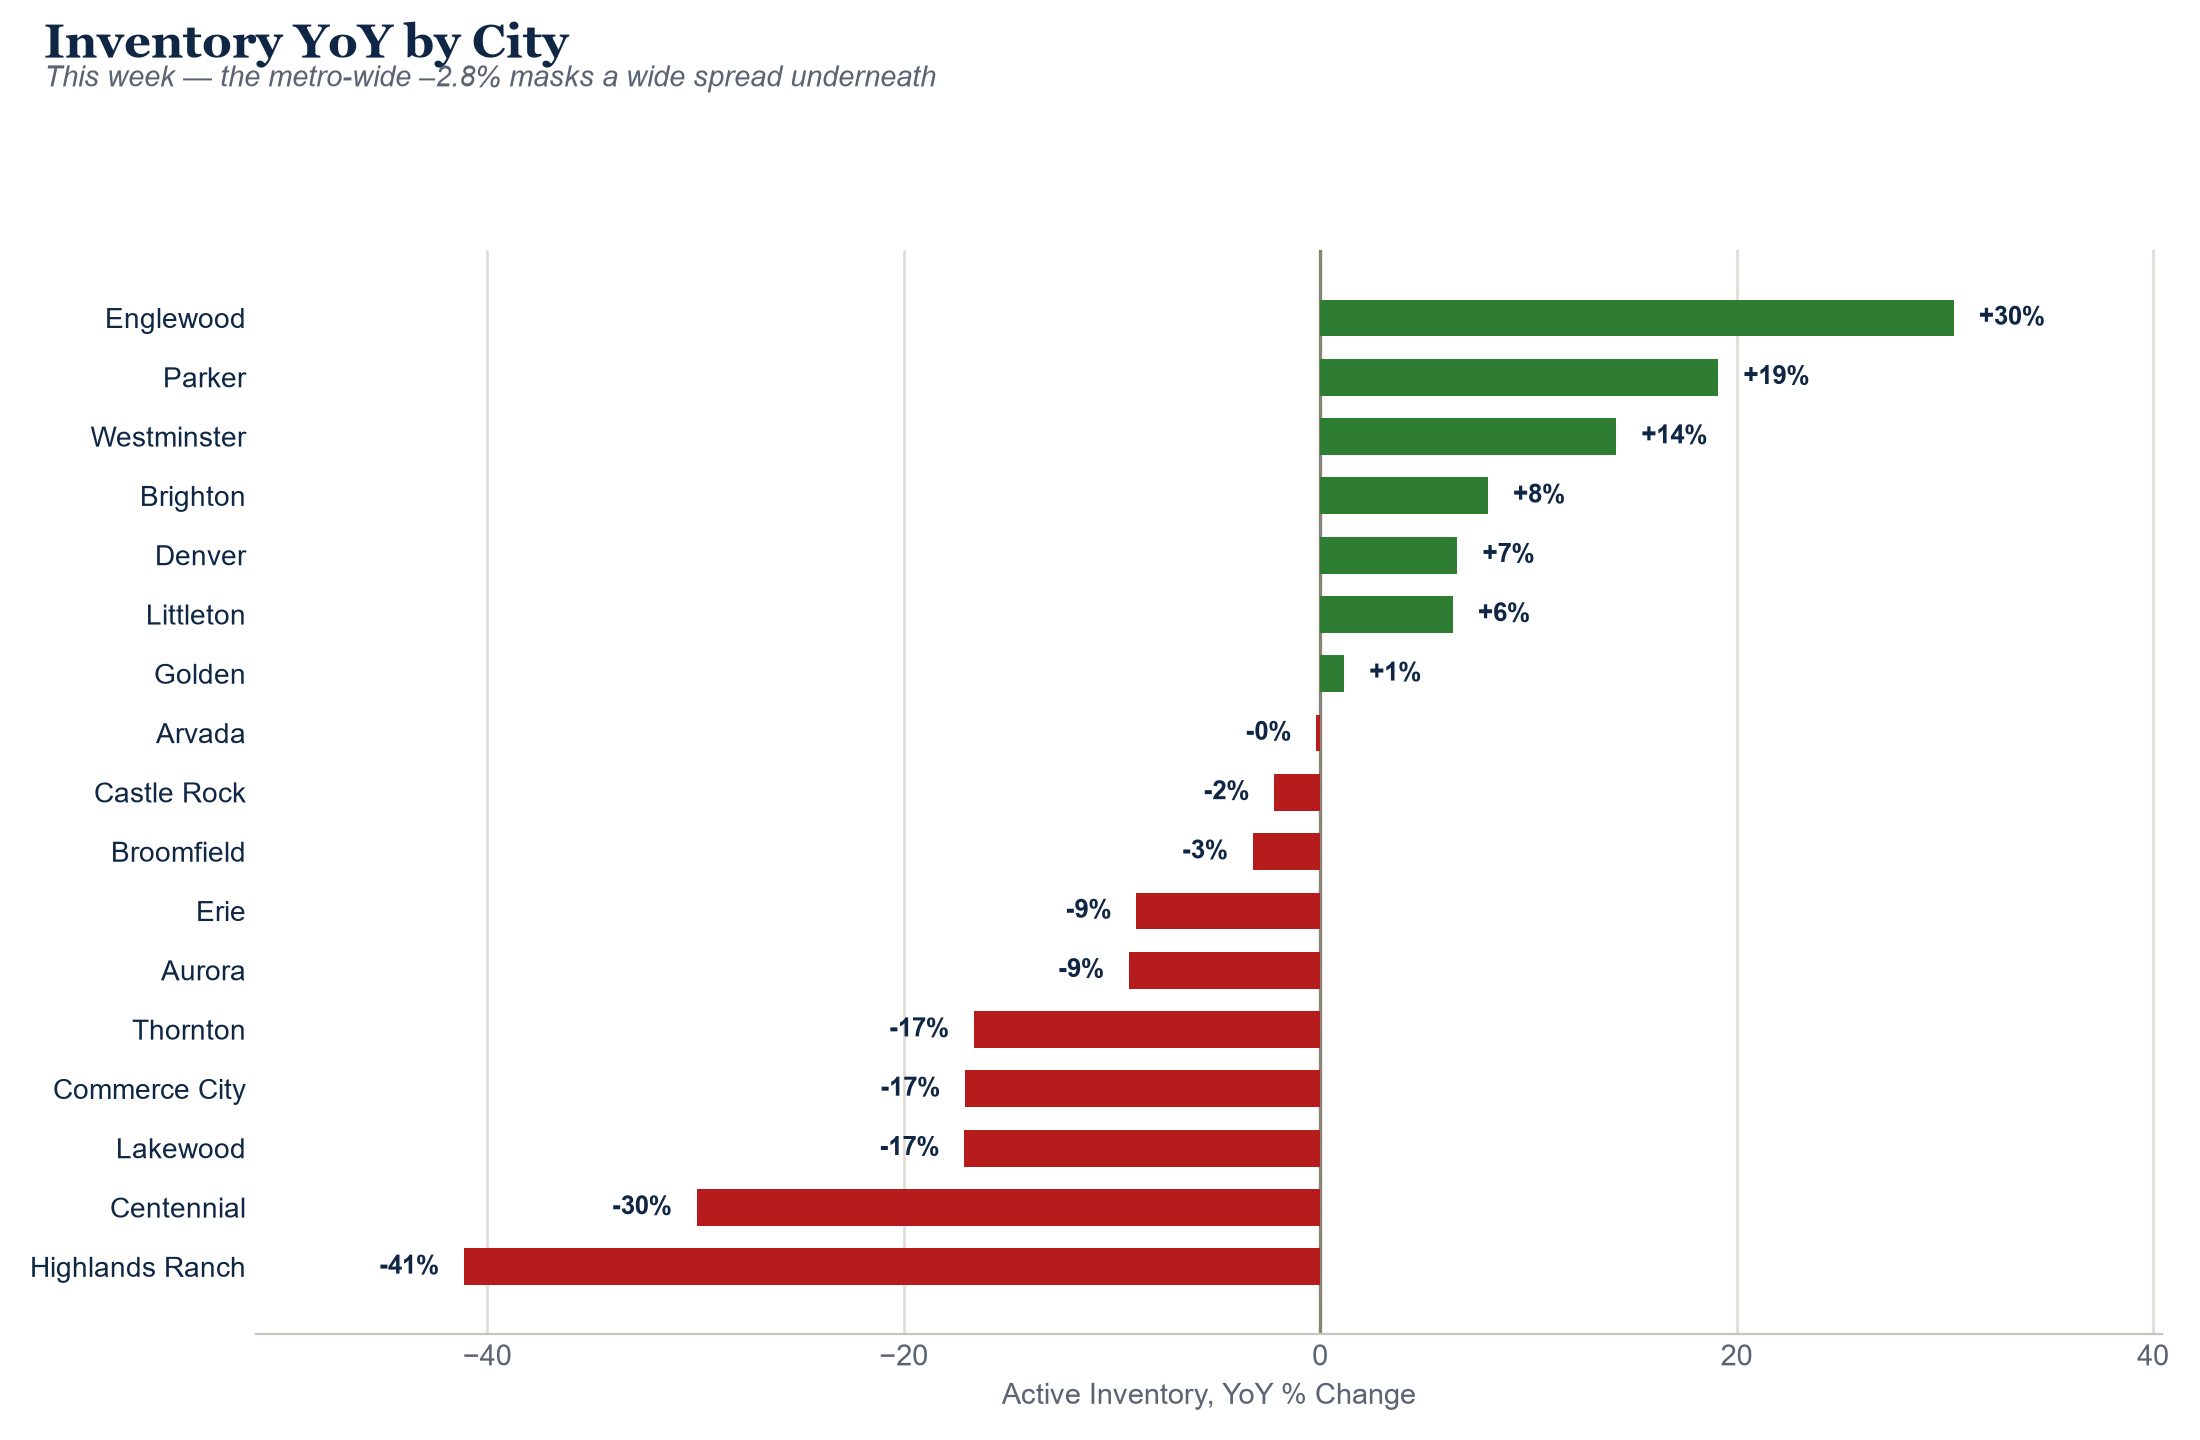
This week’s metro-wide -2.8% is really an average of two very different local markets. Highlands Ranch (-41%) and Centennial (-30%) are still running well below last year, while Englewood (+30%), Parker (+19%), and Westminster (+14%) have swung to double-digit surpluses. If you’re buying or selling in a specific city, the metro number alone won’t tell you much. Check where your city actually sits.
The Big Picture: Call Status and a New Call
The real news this week is a correction to how we read last week’s: the reported inventory crossing to positive and this week’s reported reversal back to a deficit were both distorted by the same 6-day Labor Day calendar shift, in opposite directions. Once corrected for it, active inventory’s deficit has narrowed steadily and without interruption since July, from about -13.5% to just -1.4% now, sitting right at the edge of a genuine crossing. Pending Contracts posted the mirror-image version of the same quirk this week: its 16-week losing streak broke, but the year-ago base was itself a Labor-Day-suppressed week, so that reading is almost certainly borrowed strength too. Showings, unaffected by this particular distortion, remain the clean read: still deep in an 8-week deficit. That combination, supply steadily building while demand stays weak, is exactly what’s pushing months of supply higher, and that climb is real: up to 4.47 this week, an eighth straight week of gains. That lines up with what’s happening nationally too, where months of supply has climbed toward 4.6 this summer, the most balanced the national market has been in nearly a decade, even as it remains well short of a true buyer’s market.
Call check – pending deficit: we called for the pending deficit to persist, graded specifically when showings’ YoY gap either improves past -8% for two straight weeks or worsens past -15%. Showings sit at -8.8% again this week (unchanged, no new data). Neither trigger has fired, so the call stays open on its own terms. Worth noting separately: the 16-week Pending Contracts streak did break this week, but as explained above that reading is almost certainly a Labor Day calendar artifact rather than a genuine turn, so it doesn’t count as evidence against this call. Watch next week’s Pending and Showings numbers together, both carry calendar distortions right now.
Call check – months of supply: last week we called for Total Closed MSI to keep climbing toward 5.0 over 4-8 weeks. One week in, it’s already moved from 4.29 to 4.47, real continued progress toward that threshold. Not yet resolved either direction.
New call: with the calendar-corrected deficit down to -1.4% and narrowing steadily since July, and Showings still deep in an 8-week deficit keeping fewer homes moving out of active status, we expect Active Inventory to cross back to positive year-over-year within the next 1 to 2 weeks once the Labor Day distortion clears, and to hold generally positive through the rest of 2026. We’ll grade this against the year’s final tracked week (week ending Dec 26): call right if inventory is positive YoY then, wrong if it’s negative.